KI Excel-zu-Dashboard-Konverter: Tabellen in interaktive visuelle Dashboards verwandeln
Statische Excel-Daten mit einem Klick in dynamische, teilbare Dashboards umwandeln - ganz ohne Design- oder Coding-Kenntnisse
Bringen Sie Ihre Excel-Daten mit interaktiven Dashboards zum Leben. Unsere KI verwandelt Tabellen automatisch in professionelle Visualisierungen für Stakeholder. Mit KPI-Tracking in Echtzeit, Filtern und responsivem Design erhalten Sie in Minuten Ergebnisse, für die sonst Monate Dashboard-Entwicklung nötig wären.
What is KI Excel-zu-Dashboard-Konverter: Tabellen in interaktive visuelle Dashboards verwandeln?
Bringen Sie Ihre Excel-Daten mit interaktiven Dashboards zum Leben. Unsere KI verwandelt Tabellen automatisch in professionelle Visualisierungen für Stakeholder. Mit KPI-Tracking in Echtzeit, Filtern und responsivem Design erhalten Sie in Minuten Ergebnisse, für die sonst Monate Dashboard-Entwicklung nötig wären.
TabliSync: Ihre KI-gestützte Excel-Automatisierung
Eine intelligente Automatisierungsschicht für Tabellenkalkulationen – entwickelt für reale Workflows, Datenaufgaben und Teamzusammenarbeit.
Ein-Klick-Umwandlung
Jede Excel-Tabelle mit einem Klick in ein professionelles interaktives Dashboard umwandeln. Keine Design-Kenntnisse erforderlich.
Ein-Klick-Umwandlung
Jede Excel-Tabelle mit einem Klick in ein professionelles interaktives Dashboard...
Interaktive Elemente
Filter, Drill-Down-Funktionen und interaktive Diagramme hinzufügen, mit denen Nutzer Daten dynamisch erkunden können.
Interaktive Elemente
Filter, Drill-Down-Funktionen und interaktive Diagramme hinzufügen, mit denen Nu...
Echtzeit-Updates
Dashboards aktualisieren sich automatisch bei Änderungen der Quelldaten. Stakeholder mit Live-Daten auf dem Laufenden halten.
Echtzeit-Updates
Dashboards aktualisieren sich automatisch bei Änderungen der Quelldaten. Stakeho...
Mobil optimiert
Dashboards funktionieren auf Desktop, Tablet und Mobilgeräten dank responsiver Gestaltung.
Mobil optimiert
Dashboards funktionieren auf Desktop, Tablet und Mobilgeräten dank responsiver G...
Teilen & Zusammenarbeit
Dashboards per sicheren Links teilen, in Websites einbetten oder als Präsentationen für Meetings exportieren.
Teilen & Zusammenarbeit
Dashboards per sicheren Links teilen, in Websites einbetten oder als Präsentatio...
Eigenes Branding
Unternehmensfarben, Logos und Branding anwenden für professionelle Dashboards, die zu Ihrer Marke passen.
Eigenes Branding
Unternehmensfarben, Logos und Branding anwenden für professionelle Dashboards, d...
Ein-Klick-Umwandlung
Jede Excel-Tabelle mit einem Klick in ein professionelles interaktives Dashboard umwandeln. Keine Design-Kenntnisse erforderlich.
Interaktive Elemente
Filter, Drill-Down-Funktionen und interaktive Diagramme hinzufügen, mit denen Nutzer Daten dynamisch erkunden können.
Echtzeit-Updates
Dashboards aktualisieren sich automatisch bei Änderungen der Quelldaten. Stakeholder mit Live-Daten auf dem Laufenden halten.
Ein-Klick-Umwandlung
Jede Excel-Tabelle mit einem Klick in ein professionelles interaktives Dashboard...
Interaktive Elemente
Filter, Drill-Down-Funktionen und interaktive Diagramme hinzufügen, mit denen Nu...
Echtzeit-Updates
Dashboards aktualisieren sich automatisch bei Änderungen der Quelldaten. Stakeho...
Mobil optimiert
Dashboards funktionieren auf Desktop, Tablet und Mobilgeräten dank responsiver G...
Teilen & Zusammenarbeit
Dashboards per sicheren Links teilen, in Websites einbetten oder als Präsentatio...
Eigenes Branding
Unternehmensfarben, Logos und Branding anwenden für professionelle Dashboards, d...
Mobil optimiert
Dashboards funktionieren auf Desktop, Tablet und Mobilgeräten dank responsiver Gestaltung.
Teilen & Zusammenarbeit
Dashboards per sicheren Links teilen, in Websites einbetten oder als Präsentationen für Meetings exportieren.
Eigenes Branding
Unternehmensfarben, Logos und Branding anwenden für professionelle Dashboards, die zu Ihrer Marke passen.
TabliSync in Aktion: Produktdemo
Sehen Sie, wie TabliSync komplexe Tabellenkalkulations-Workflows in Minuten in einfache, automatisierte Prozesse verwandelt.
Daten zum Leben erwecken
Verwandeln Sie langweilige Excel-Tabellen in ansprechende, interaktive Dashboards, die überzeugende Daten-Geschichten erzählen und Aufmerksamkeit wecken.
Stakeholder überzeugen
Präsentieren Sie Daten in professionellen, interaktiven Dashboards, die Führungskräfte und Kunden begeistern. Machen Sie Ihre Erkenntnisse unübersehbar.
Entwicklungszeit sparen
Monatelange Dashboard-Entwicklung überspringen. Professionelle Ergebnisse in Minuten statt Wochen. Kein Programmieren oder Design-Kenntnisse nötig.
Vorher vs Nachher: Die TabliSync-Transformation
Vergleichen Sie manuelle Workflows mit intelligenter Automatisierung und sehen Sie, wie Teams Zeit sparen und Fehler reduzieren.
Traditioneller Weg
Der alte Weg
- Viele manuelle Schritte und hoher Zeitaufwand
- Uneinheitliche Ausführung im Team
- Fehler und Lücken treten leicht auf
- Pflege und Aktualisierung erfordern Nacharbeit
- Schlecht auf wachsende Anforderungen skalierbar
Mit TabliSync
Der bessere Weg
- KI automatisiert wiederkehrende Aufgaben
- Standardisierte Abläufe und konsistente Ergebnisse
- Weniger manuelle Fehler und Nacharbeit
- Änderungen schneller übernehmen und ausrollen
- Skalierbar für größere Workloads
So funktioniert es - Einfache Schritte für den Einstieg
Einfache Schritte zum Einstieg und zur Transformation Ihres Daten-Workflows
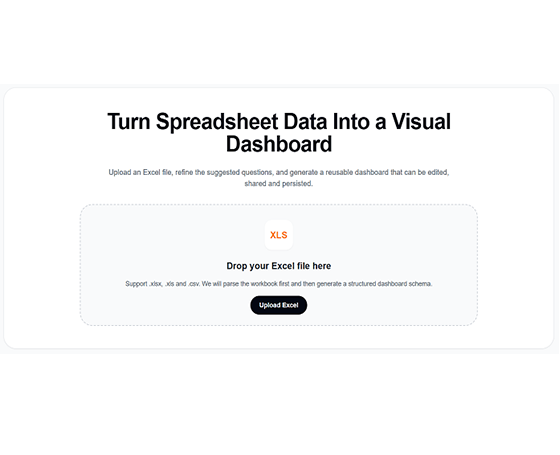
Excel-Datei hochladen
Ihre Excel-Tabelle mit Daten importieren. KI analysiert die Struktur und identifiziert Kennzahlen und Dimensionen.
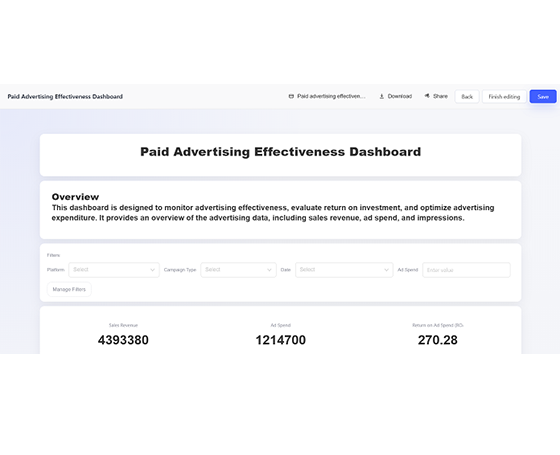
KI erstellt Dashboard
KI erzeugt automatisch ein interaktives Dashboard mit passenden Diagrammen, Filtern und Layout basierend auf Ihren Daten.
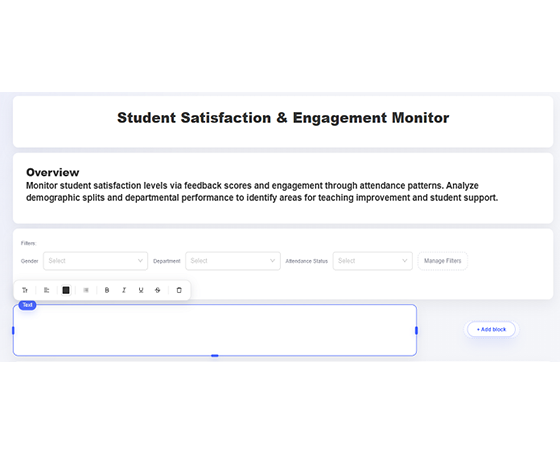
Anpassen und verfeinern
Farben anpassen, Filter hinzufügen, Diagrammtypen ändern und das Layout nach Ihren Wünschen anpassen.
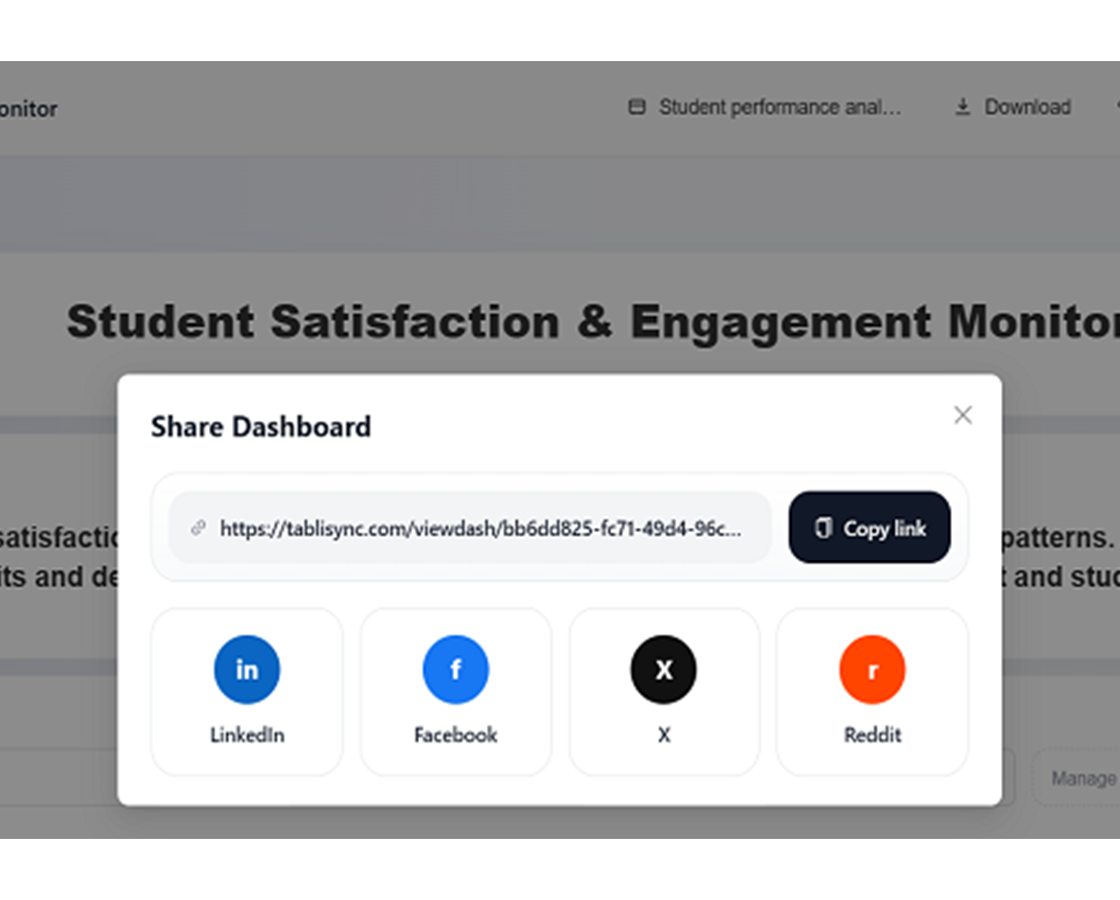
Teilen und zusammenarbeiten
Dashboard mit sicherem Link veröffentlichen, in Websites einbetten oder für Präsentationen exportieren.
Excel-Datei hochladen
Ihre Excel-Tabelle mit Daten importieren. KI analysiert die Struktur und identifiziert Kennzahlen und Dimensionen.
KI erstellt Dashboard
KI erzeugt automatisch ein interaktives Dashboard mit passenden Diagrammen, Filtern und Layout basierend auf Ihren Daten.
Anpassen und verfeinern
Farben anpassen, Filter hinzufügen, Diagrammtypen ändern und das Layout nach Ihren Wünschen anpassen.
Teilen und zusammenarbeiten
Dashboard mit sicherem Link veröffentlichen, in Websites einbetten oder für Präsentationen exportieren.
Echte Ergebnisse: Erfahrungsberichte
Feedback von Teams und Profis, die mit TabliSync jede Woche Stunden sparen.
"Unsere Executive-Meetings sind mit Echtzeit-Dashboards deutlich besser geworden."

Richard Martinez
CEO
"Früher habe ich Stunden mit Chart-Updates verbracht. Jetzt aktualisieren sie sich selbst."

Karen White
Business Analystin
"Stakeholder lieben die professionellen Dashboards - viel besser als Excel-Screenshots."

Steven Clark
Produktmanager
Dashboard-Use-Cases nach Rolle
Aus Tabellen KPI-Dashboards für Führung, Analysten und Ops erstellen.
Vertriebsteams
Vertriebsdaten in dynamische Dashboards für Leistung, Pipeline und Umsatzkennzahlen umwandeln.
Vertriebsleistungs-Dashboards
Pipeline-Tracking-Visualisierungen
Umsatztrend-Analyse
Marketing-Abteilungen
Kampagnendaten in interaktive Dashboards für ROI-, Engagement- und Conversion-Metriken umwandeln.
Kampagnenleistungs-Tracking
Social-Media-Analytics-Dashboards
Lead-Generierungs-Visualisierungen
Führungsebene
Executive-Dashboards aus Finanz- und Betriebsdaten für strategische Entscheidungen erstellen.
Executive-KPI-Dashboards
Finanzleistungs-Tracking
Betriebsmetriken-Visualisierung
Projektmanager
Projektdaten in visuelle Dashboards für Fortschritt, Ressourcen und Lieferables umwandeln.
Projektzeitplan-Dashboards
Ressourcenallokations-Tracking
Meilenstein-Fortschritts-Visualisierung
Häufig gestellte Fragen
Antworten auf häufige Fragen zu dieser Funktion, zur Nutzung und zu den Ergebnissen.
Wie stellt TabliSync die Sicherheit und Vertraulichkeit von Dashboard-Quelltabellen sicher?
Arbeitsmappen-Uploads und Dashboard-Erstellung werden über verschlüsselte Kanäle mit Workspace-Zugriffskontrolle verarbeitet. Sie steuern, wer Dashboard-Ausgaben ansehen, bearbeiten und teilen kann.
Wie verwandle ich schnell eine Excel-Datei in ein interaktives Dashboard?
Laden Sie die Arbeitsmappe hoch, wählen Sie KPI-Schwerpunkte und lassen Sie die KI Diagrammblöcke und Filter generieren. Passen Sie anschließend das Layout an und veröffentlichen Sie es für Ihr Team.
Können Dashboard-Kennzahlen automatisch aktualisiert werden, wenn sich Quell-Excel-Daten ändern?
Ja. Sie können Aktualisierungsverhalten konfigurieren, damit KPI-Panels mit aktualisierten Quelldaten übereinstimmen und manuelle Berichts-Neuerstellung reduziert wird.
Was ist die beste Dashboard-Struktur für wöchentliche Führungs-KPI-Reviews?
Verwenden Sie eine obere Summenzeile, Trend-Panels, Varianzaufschlüsselung und Drill-down-Filter nach Region oder Produkt. Das macht Entscheidungsmeetings schneller und konsistenter.
Können Teams dasselbe Dashboard mit rollenbasierten Berechtigungen teilen?
Ja. Teams können Dashboard-Ansichten mit kontrollierten Berechtigungen teilen, sodass Mitwirkende und Stakeholder die passende Detailtiefe sehen.
Kann ich Unternehmens-Branding auf KI-generierte Dashboards anwenden?
Ja. Sie können Farben, Beschriftungen und visuellen Stil anpassen, damit Ausgaben internen Reporting-Standards und externen Präsentationsanforderungen entsprechen.
Warum TabliSync mehr ist als nur ein Konverter
Transformieren Sie Ihren Daten-Workflow mit unserem KI-gestützten Ökosystem für plattformübergreifendes Datenmanagement, Zusammenarbeit und Automatisierung.
Plattformübergreifender Sync
Ihre konvertierten Daten werden automatisch mit Google Sheets, Notion, Airtable und anderen Plattformen synchronisiert. Kein manuelles Importieren oder Exportieren nötig.
Echtzeit-Zusammenarbeit
Teilen und bearbeiten Sie Ihre extrahierten Daten sofort. Teammitglieder können plattformübergreifend gleichzeitig auf Daten zugreifen, sie bearbeiten und analysieren.
Automatisierte Aktualisierungen
Richten Sie automatische Datenaktualisierungen ein. Ihre Tabellen bleiben ohne manuellen Eingriff aktuell und sparen Stunden wiederholter Arbeit.
Dem vollständigen Daten-Ökosystem beitreten
Erschließen Sie das volle Potenzial Ihrer Daten mit unserer integrierten KI-Tool-Suite
Bereit, Ihren Daten-Workflow zu transformieren?
Schließen Sie sich Tausenden Fachleuten an, die TabliSync für ihre Daten vertrauen
Keine Kreditkarte nötig • Über 10.000 Nutzer synchronisieren täglich Daten