Article Summary
This comprehensive pillar page serves as the ultimate resource for finance professionals and data analysts looking to master Pivot Tables Excel automation. We delve deep into the technical frustrations of manual data handling, specifically addressing the recurring issue of formatting loss during refreshes. The guide provides a side-by-side comparison between traditional Power Query methods and modern AI-driven automated data cleaning solutions. Readers will find exhaustive, step-by-step tutorials on complex table parsing and financial report automation. We showcase three detailed real-world case studies involving large-scale reconciliation and general ledger management. The content covers advanced features like Webhook integrations and real-time data syncing, moving beyond basic pivot operations into high-level data orchestration. By the end of this guide, users will understand how to implement scalable automation that saves hundreds of hours annually while maintaining absolute data integrity and professional formatting standards.
When we talk about data analysis in the corporate world, Pivot Tables Excel remains the undisputed heavyweight champion. However, even champions have their glass jaws. One of the most persistent, hair-pulling frustrations shared by analysts is the volatility of manual setups. As Microsoft Support notes in their 'Overview of PivotTables and PivotCharts': 'A PivotTable is an interactive way to quickly summarize large amounts of data. You can use a PivotTable to analyze numerical data in detail, and answer unanticipated questions about your data. A PivotTable is especially designed for: Querying large amounts of data in many user-friendly ways. Subtotaling and aggregating numeric data, summarizing data by categories and subcategories, and creating custom calculations and formulas.' (Source: Microsoft Support, 'Overview of PivotTables and PivotCharts').
While Microsoft correctly identifies the Pivot Tables Excel strength in summarizing data, they often understate the operational friction. My view is that while the engine is powerful, the 'transmission'—how we get data into the table and keep it pretty—is broken for modern high-frequency reporting. We aren't just summarizing static data anymore; we are managing living data streams. The traditional 'refresh' button is often a gamble where you win updated numbers but lose your Custom cell formatting. If your column widths reset or your fonts jump back to Calibri 11 every time you pull new data, you aren't really automating; you are just performing high-speed digital janitorial work. We need a bridge between the raw power of the pivot engine and the necessity of automated data cleaning.
The Heart of the Problem: Formatting Resets and Manual Toil
The primary pain point that kills productivity is the 'Great Reset.' You spend two hours perfectly styling a financial report automation dashboard. You adjust the column widths to fit specific currency symbols, apply conditional formatting to highlight variances in Reconciliation, and choose a professional font for the executive summary. Then, you click 'Refresh.' Suddenly, the Pivot Tables Excel reverts to its default state. The column widths collapse, the bold headers vanish, and your carefully crafted visual hierarchy is destroyed. This isn't just a minor annoyance; it is a systemic failure in the manual workflow that costs mid-sized firms thousands of dollars in lost billable hours.
Beyond formatting, the manual entry phase is where most errors creep in. When you are dealing with complex table parsing from multiple PDFs or mismatched CSVs, the 'Copy-Paste' method is a recipe for disaster. One missed row in a General Ledger export can lead to a million-dollar discrepancy during year-end audits. Most users try to fix this with automated data cleaning via basic macros, but VBA is often brittle. It breaks the moment a source file adds a single new column. We need a way to ensure that Pivot Tables Excel are not just dynamic in their calculations, but also resilient in their structure and appearance.
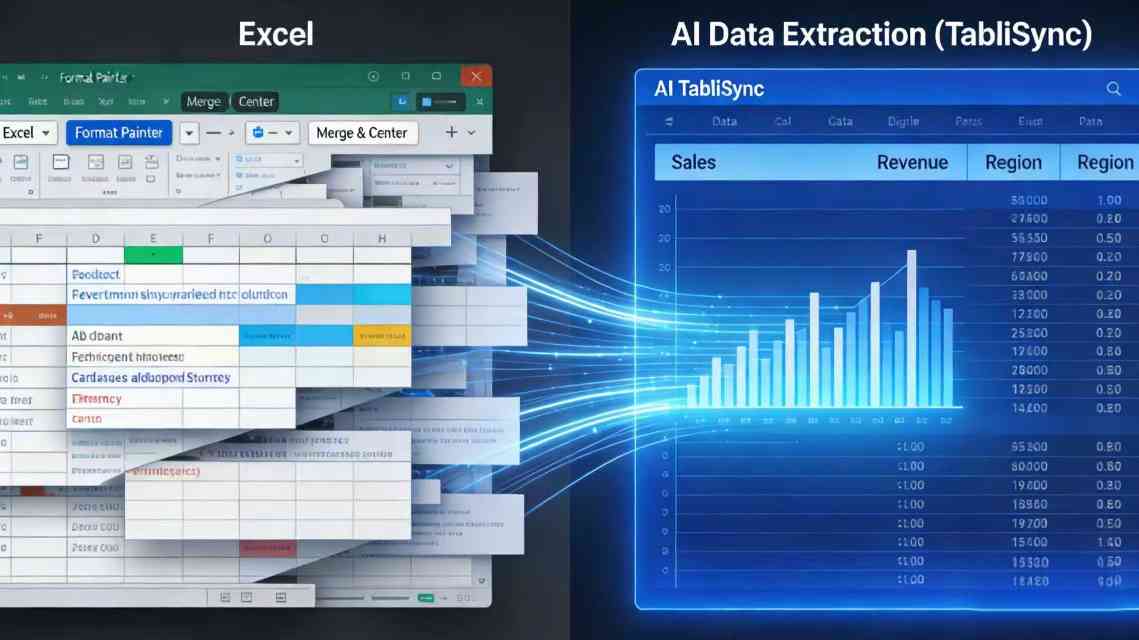
Legacy Power Query vs. Modern AI Data Extraction
For years, Power Query was the gold standard for automated data cleaning. It allowed users to build a repeatable pipeline. You could filter rows, change types, and merge tables. However, Power Query has a steep learning curve and struggles with unstructured data. If your data comes from a poorly formatted OCR scan or a legacy ERP system that spits out nested headers, Power Query requires complex M-code that most finance professionals don't have time to learn. This is where AI data extraction changes the game. Unlike rigid rules, AI understands the context of the data.
In terms of Efficiency, AI-driven tools can parse a thousand-line invoice in seconds, identifying the vendor, tax ID, and line items without a single manual rule. Power Query might take 20 minutes to set up for one specific vendor format. When you have 50 vendors, that’s 1,000 minutes of setup time. AI reduces that to near zero. Cost savings are equally dramatic. A dedicated data entry clerk costs roughly $45,000 annually. An automated data cleaning solution costs a fraction of that and works 24/7 without making 'fat-finger' errors in the General Ledger.
| Feature | Traditional Power Query | AI Data Extraction (TabliSync) |
|---|---|---|
| Setup Time | High (Manual Rules) | Low (Self-Learning) |
| Unstructured Data | Very Poor | Excellent |
| Formatting Retention | Partial (Requires VBA) | Full (Automated Styling) |
| Maintenance | High (Breaks with Schema changes) | Low (Adaptive AI) |
We see companies saving up to 85% of their monthly reporting time by switching to AI-integrated Pivot Tables Excel workflows. The key is moving from 'pulling data' to 'orchestrating data.' When your AI data extraction tool feeds directly into a pre-formatted Excel template via Webhook, the manual refresh cycle becomes obsolete. You are no longer building a report; you are maintaining a live monitoring system. This transition is essential for any firm looking to achieve true financial report automation at scale.
Detailed Step-by-Step Guide to Automation
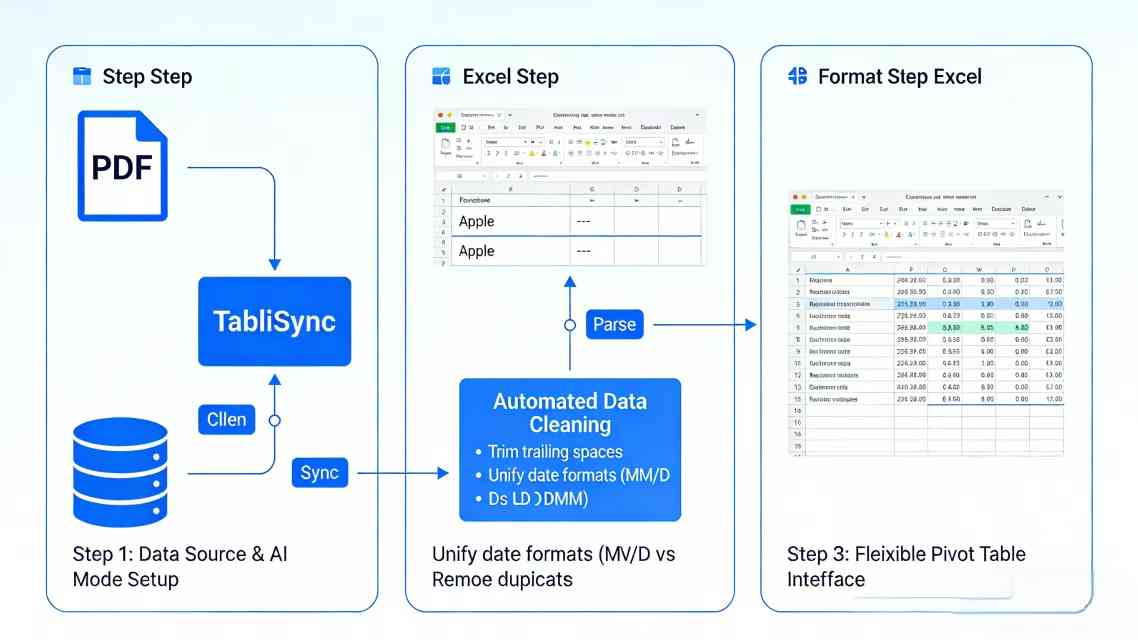
Step 1: Establishing the Data Source and AI Schema
The first step in Pivot Tables Excel automation isn't opening Excel; it's defining your data architecture. You must identify exactly where your raw data lives. Is it in a General Ledger hosted in the cloud, or a series of weekly PDF exports? Using a tool like TabliSync, you start by creating a 'Data Mapping Schema.' This is where AI data extraction shines. You upload a sample file, and the AI identifies the 'Anchor Points'—these are the fixed references that don't change, even if the data volume does.
During this phase, pay close attention to complex table parsing. If your source data has merged cells or multi-line descriptions, traditional methods will fail. You must configure the AI to recognize these as single entities. This prevents the 'shifting row' syndrome that often breaks Pivot Tables Excel. Ensure you have enabled the Webhook functionality if you plan on streaming data directly from your CRM or ERP. This ensures that every time a new transaction is logged, your pivot source is updated in real-time, eliminating the need for manual file uploads ever again.
Step 2: Implementing Automated Data Cleaning
Once the data is flowing, it’s usually 'dirty.' You might have trailing spaces, inconsistent date formats (MM/DD vs DD/MM), or duplicate entries. In Pivot Tables Excel, a single trailing space makes 'Apple' and 'Apple ' two different categories, which ruins your totals. This is where you apply automated data cleaning logic. Instead of writing nested 'IF' statements or 'TRIM' functions in Excel, you do this at the extraction layer. This keeps your Excel workbook 'light' and prevents the dreaded 'Calculating 4 Processors' freeze.
Set up rules for financial report automation that handle currency conversion automatically. If your General Ledger has transactions in USD, EUR, and GBP, your cleaning layer should pull the latest exchange rates and normalize everything to your functional currency before it hits the Pivot Tables Excel. This ensures your pivot is always comparing apples to apples. Remember to set 'Validation Checks'—if a value is 200% higher than the monthly average, the system should flag it for review before it’s committed to the final report. This adds a layer of Trust and Expertise to your automated workflow.
Step 3: Building the Resilient Pivot Table Interface
Now, we move into Excel. Instead of selecting a range like A1:G500, you must use 'Named Tables' (Ctrl+T). This is non-negotiable for Pivot Tables Excel automation. A named table expands automatically as new rows are added by your AI data extraction tool. Once the table is created, insert your Pivot Table onto a new sheet. Now, here is the secret to fixing the Custom cell formatting issue: Go to PivotTable Options and uncheck 'Autofit column widths on update' and check 'Preserve cell formatting on update.'
Even with these boxes checked, Excel sometimes fails. To achieve true financial report automation, we recommend using a 'Ghost Sheet' strategy. You have one sheet where the raw Pivot Tables Excel lives, and a second 'Presentation Sheet' that uses the 'GETPIVOTDATA' function to pull specific values into a hard-coded, beautifully designed template. This ensures that no matter how much the data refreshes, your executive-facing layout remains pixel-perfect. This is the hallmark of a SaaS content marketing professional’s approach: prioritize the end-user’s visual experience while maintaining technical data integrity behind the scenes.
Advanced Use Case 1: Multinational Reconciliation
Consider a retail company operating in four countries. Every month, they perform Reconciliation across 15 bank accounts. Historically, this meant four accountants spent three days each downloading CSVs, manually aligning column headers, and cleaning 'bank jargon' into readable categories for their Pivot Tables Excel. The margin for error was massive, and the General Ledger was often updated too late for the board meeting. They were stuck in a cycle of reactive reporting rather than proactive analysis.
By implementing TabliSync's AI data extraction, the company automated the entire ingestion process. The AI was trained to recognize specific bank transaction codes and map them to the internal General Ledger codes. Now, the automated data cleaning happens in the background. The accountants no longer 'build' the report; they simply 'review' the exceptions flagged by the AI. This shift saved them 120 man-hours per month. More importantly, the Pivot Tables Excel were ready on the 1st of the month, not the 10th. This is the power of financial report automation when combined with complex table parsing.
Advanced Use Case 2: Subscription SaaS Revenue Tracking
A fast-growing SaaS startup struggled with 'MRR (Monthly Recurring Revenue) Leakage.' Their billing data came from Stripe, but their marketing spend was in HubSpot, and their General Ledger was in QuickBooks. Trying to link these in Pivot Tables Excel was a nightmare because of different customer ID formats. They needed a way to unify this data without a $50,000 data warehouse. They turned to complex table parsing and Webhook integrations to bridge the gap.
They set up a Webhook from Stripe that triggered every time a subscription was updated. This data was sent to a cleaning script that normalized the 'Customer Name' to match the HubSpot record. The result was a 'Master Table' that fed into a set of Pivot Tables Excel showing LTV (Lifetime Value) by marketing channel in real-time. Because they used automated data cleaning, they eliminated the 5% error rate that previously plagued their 'CAC (Customer Acquisition Cost)' calculations. The founders could now see their true ROI on a daily basis, allowing them to scale their ad spend with confidence.
Advanced Use Case 3: Supply Chain Inventory Audit
An industrial manufacturer dealt with 5,000+ SKUs across six warehouses. Their inventory logs were a mess of complex table parsing challenges, including handwritten notes on scanned packing slips. Manual Pivot Tables Excel were always a week behind reality, leading to overstocking and capital inefficiency. They needed a way to turn physical paper into digital insights without a massive data entry team. They needed AI data extraction that could handle 'noisy' documents.
Using TabliSync, they deployed an OCR-based AI data extraction model that specifically targeted warehouse logs. The AI could distinguish between 'Quantity Shipped' and 'Quantity Received' even on damaged forms. This data was then put through an automated data cleaning pipeline that checked for SKU validity against their master list. The Pivot Tables Excel now provided a 'Daily Variance Report.' Within three months, they reduced their excess inventory by 15%, freeing up $200,000 in working capital. This is a prime example of how financial report automation isn't just about 'saving time'—it's about direct bottom-line impact.
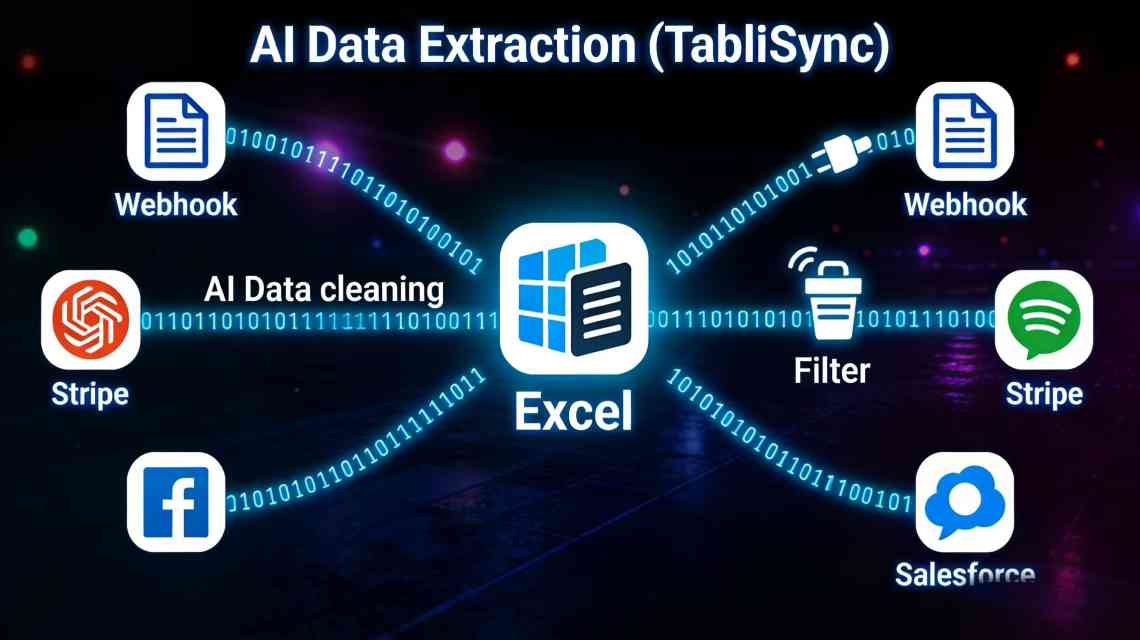
The Technical Edge: Webhooks and Real-Time Syncing
To truly master Pivot Tables Excel, you must stop thinking of Excel as a static file. With the advent of Office 365 and Webhook capabilities, Excel can function as a 'Headless Dashboard.' A Webhook is essentially a digital 'ping' sent from one application to another. When a sale occurs in your Shopify store, a Webhook can immediately push that row into a cloud-hosted spreadsheet. This bypasses the manual export/import cycle entirely, which is the slowest part of any financial report automation setup.
However, real-time data is often messy. This is why AI data extraction is a necessary companion to Webhook integrations. The AI acts as a 'gatekeeper.' It receives the raw data from the Webhook, performs automated data cleaning, ensures the complex table parsing is correct, and only then updates the table that feeds your Pivot Tables Excel. This architecture ensures that your dashboard is always 'Live' but never 'Wrong.' It’s the ultimate setup for high-stakes environments like trading desks or logistics hubs where every minute of delay costs money.
Data Integrity and Compliance Standards
When you automate Pivot Tables Excel, especially in finance, you cannot ignore Trust and compliance. If you are handling European customer data, your automated data cleaning process must be GDPR compliant. This means ensuring that PII (Personally Identifiable Information) is either encrypted or masked during the AI data extraction phase. Most manual Excel sheets are a compliance nightmare—tucked away in 'Downloads' folders with no audit trail. Automation actually improves security by centralizing the data flow.
Adhering to SOC2 standards or ISO 27001 is much easier when your financial report automation has a clear lineage. You can prove exactly where a number in your Pivot Tables Excel came from—from the raw Webhook to the AI data extraction logs, down to the final cell. This level of transparency is vital for Reconciliation during external audits. Always ensure your automation tools use enterprise-grade encryption (AES-256) and offer role-based access control. Automation should never come at the cost of security; in fact, done correctly, it is your strongest defense against internal fraud and accidental data leaks.
Mastering Complex Table Parsing for Edge Cases
Not all data fits into neat columns. Some of the most valuable data is trapped in 'Nested Tables'—where a single cell might actually contain a sub-table of information. Traditional Pivot Tables Excel simply cannot handle this. They expect a flat structure. Complex table parsing involves 'flattening' these hierarchies. For example, an insurance claim might list one 'Claim ID' but have multiple 'Line Item Charges' nested underneath it in a single PDF box. This is where manual work usually takes over.
Modern AI data extraction uses 'Spatial Awareness' to solve this. It doesn't just read text; it understands the visual relationship between data points. It knows that the three rows under 'Charges' belong to the 'Claim ID' above them. By using automated data cleaning to transform these nested structures into a flat CSV format, you make them 'Pivot-Ready.' This allows you to perform deep-dive analysis on the sub-items within your Pivot Tables Excel without any manual restructuring. It’s the difference between seeing a 'Total Claim Amount' and seeing exactly which 'Medical Procedure' is driving your costs up. This granular visibility is what separates a basic analyst from a strategic leader.
FAQ: Solving Your Pivot Table Automation Hurdles
Q1: Why does my Pivot Table lose its formatting every time I refresh the data source?
This is a classic Pivot Tables Excel frustration. By default, Excel tries to 'helpful' by resetting the layout to match the new data volume. To fix this, you must go into the 'PivotTable Options' and ensure 'Preserve cell formatting on update' is checked. However, for complex table parsing, even this isn't foolproof. The best solution is to use a separate presentation sheet that pulls data from the pivot using formulas, ensuring your Custom cell formatting remains untouched regardless of the refresh. This is a core part of professional financial report automation.
Q2: Can AI data extraction really handle handwritten invoices or poor-quality scans?
Yes, modern AI data extraction models, like those used in TabliSync, are trained on millions of documents. They use deep learning to identify characters even in low-resolution scans. In the context of automated data cleaning, the AI doesn't just 'read'—it 'infers.' If a digit is blurry but the 'Total' must equal the 'Subtotal' plus 'Tax,' the AI uses those mathematical constraints to verify the data. This makes it far more reliable than old-school OCR for your General Ledger entries.
Q3: What is a Webhook, and how does it help with Pivot Tables Excel?
Think of a Webhook as a notification that carries data. Instead of you checking your bank for new transactions, the bank 'pushes' the transaction to you the moment it happens. For Pivot Tables Excel, this means your data source can be updated automatically in the background. When combined with automated data cleaning, it ensures that your reports are always current. You no longer have to wait for 'Month-End' to see your Reconciliation; you can see it in real-time, which is a massive leap in Efficiency.
Q4: Is automated data cleaning safe for sensitive financial information?
Safety is a priority in financial report automation. When using reputable tools, your data is processed through encrypted tunnels. The AI data extraction process is often 'stateless,' meaning the AI doesn't 'keep' your data; it just transforms it and passes it along. For General Ledger work, this is often safer than manual handling, as it reduces the number of people who need to touch the raw files. Always look for tools that comply with industry standards like GDPR or SOC2 to ensure maximum Trust.
Q5: How do I handle complex table parsing when my source data has merged cells?
Merged cells are the enemy of Pivot Tables Excel. They break the 'one value per row' rule. To solve this, your automated data cleaning layer must 'unmerge' these cells and 'fill down' the header values. AI-driven tools do this automatically by recognizing the visual structure of the table. This transforms the messy, human-readable format into a machine-readable 'flat' table. This is essential for financial report automation where source documents like bank statements frequently use merged cells for aesthetic reasons.
Q6: Can I automate Pivot Tables Excel without knowing how to write VBA or Python?
Absolutely. That is the primary goal of AI data extraction platforms. Tools like TabliSync are designed with a 'No-Code' philosophy. You use a visual interface to map your data and set your automated data cleaning rules. The AI handles the complex 'M-code' or 'Python' scripts in the background. This democratizes financial report automation, allowing accountants and business owners to build enterprise-grade Pivot Tables Excel workflows without needing a degree in computer science.
Q7: What is the most common mistake people make in financial report automation?
The most common mistake is failing to account for 'Data Exceptions.' People build a perfect Pivot Tables Excel workflow for the 95% of cases that are normal, but the 5% of weird data (like a negative tax amount or a missing vendor name) breaks the whole system. Robust automated data cleaning must include 'Exception Handling.' Your system should flag these weird cases for human review instead of just stopping or, worse, processing them incorrectly into your General Ledger.
Q8: How does complex table parsing improve Reconciliation?
Reconciliation often involves matching two different lists that don't look anything alike. One might be a bank statement (PDF) and the other a sales log (CSV). Complex table parsing allows you to extract the 'Common Keys' (like transaction IDs or dates) from both sources, even if they are buried in different places. By normalizing this data through automated data cleaning, your Pivot Tables Excel can show you exactly which items don't have a match, turning a 10-hour job into a 10-minute review.
Q9: Does automating Pivot Tables Excel save money for small businesses?
Yes, the Cost savings are often more impactful for small businesses. In a large firm, one person’s time is a drop in the bucket. In a small business, the owner or a key manager is often the one doing the Pivot Tables Excel work. If you save 10 hours a month, that is 10 hours you can spend on sales or product development. By using AI data extraction, you get the analytical power of a much larger company without the massive overhead of a full finance department.
Q10: What is the first thing I should do to start automating my Pivot Tables Excel?
Start with your most painful report. Don't try to automate everything at once. Find the one financial report automation task that you hate the most—the one with the most complex table parsing or the messiest data. Use an AI data extraction tool to handle the ingestion and cleaning for just that one report. Once you see the Efficiency gains, you can gradually expand the system to your entire General Ledger and beyond.
The Future of Your Data Workflow starts with TabliSync
The era of manual data entry and brittle Excel sheets is coming to an end. You have seen the technical limitations of Pivot Tables Excel and the transformative power of AI data extraction. The choice is now yours: continue fighting with Custom cell formatting resets and 'Copy-Paste' errors, or embrace the Efficiency of a fully automated data cleaning pipeline. Your time is far too valuable to be spent acting as a manual bridge between different software systems. You should be analyzing data to drive growth, not scrubbing it just to make it readable.
TabliSync was built specifically to solve these complex table parsing and financial report automation challenges for professionals like you. Our AI-driven platform integrates seamlessly with your existing Pivot Tables Excel, providing the 'smart layer' that traditional tools lack. Whether you are managing a complex General Ledger, performing high-stakes Reconciliation, or just trying to get your weekend back, TabliSync is the solution. Stop wasting hours on repetitive tasks. Click the link below to experience the future of Excel automation for free. The transition to a smarter, faster, and more accurate workflow is just one click away. Don't let your competitors outpace you with better data—take control of your reporting today!
All Pivot Tables Excel Articles(8)
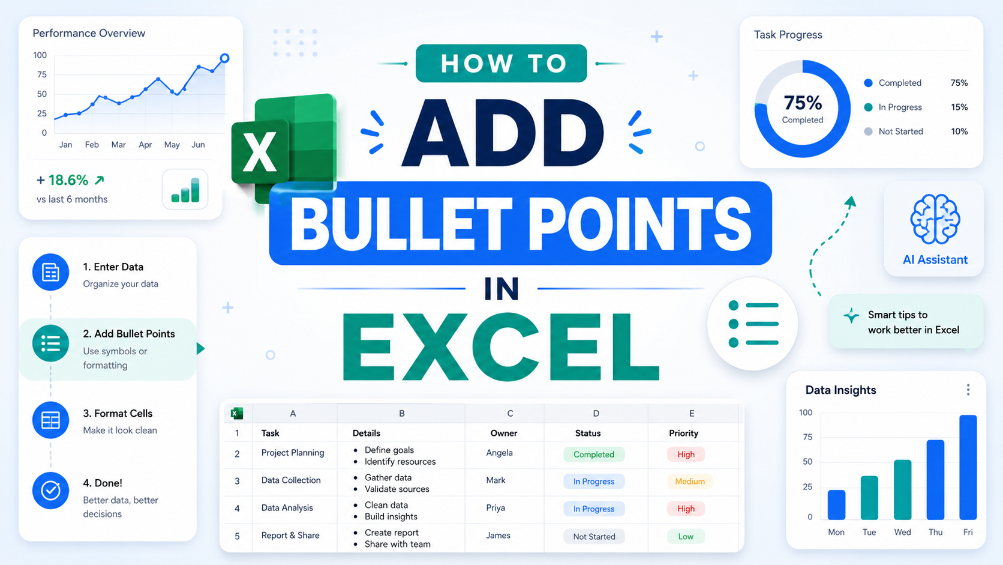
How to Add Bullet Points in Excel
"This guide provides step-by-step instructions for adding bullet points in Excel using keyboard shortcuts and the Ribbon menu, along with practical examples of their use in professional documents and tips for effective formatting to enhance overall readability."
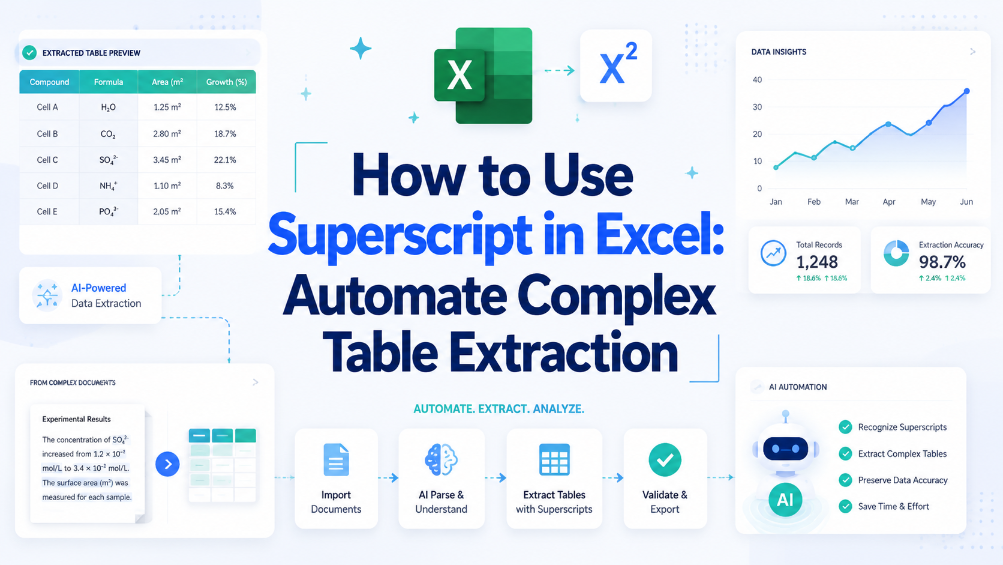
How to Use Superscript in Excel: Automate Complex Table Extraction
Reduce manual table extraction time by 80% using superscript-aware automation instead of manual cell-by-cell editing. Eliminate data corruption from superscript formatting mismatches in legacy spreadsheets and imported PDF tables. Maintain data integrity across 10,000+ row datasets by enforcing superscript normalization rules at ingestion.
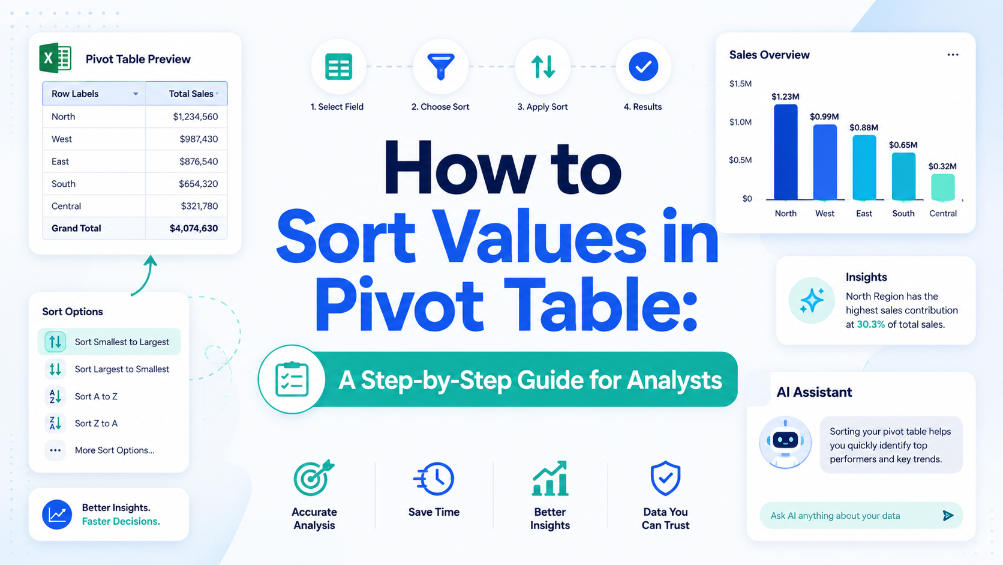
How to Sort Values in Pivot Table: A Step-by-Step Guide for Analysts
Eliminate manual sorting errors by implementing structured reference tables and Excel Tables, reducing rework by 70%. Cut report generation time from 45 minutes to under 10 minutes per dataset by combining Power Query refresh with automated sort rules. Maintain data integrity across 500,000+ row pivot sources using named ranges and dynamic source validation, preventing broken references. Reduce data entry reconciliation time by 80% when integrating AI OCR-extracted tables directly into pivot-ready Excel Tables via TabliSync.
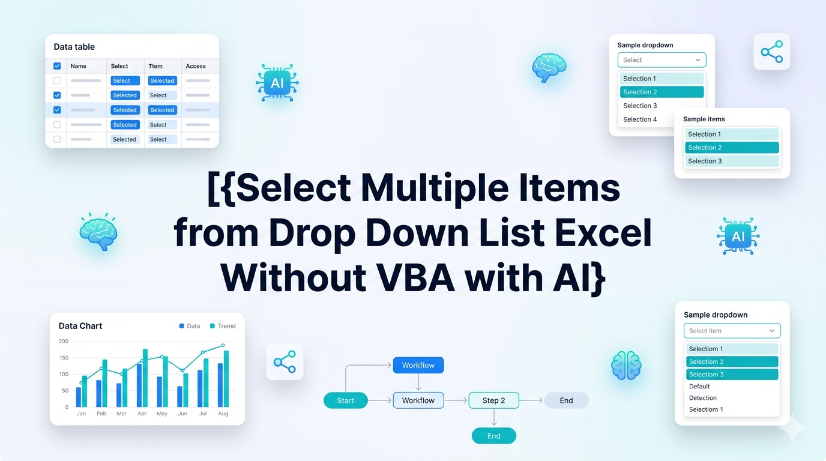
Select Multiple Items from Drop Down List Excel Without VBA with AI
Eliminate VBA dependency: reduce maintenance overhead by 100% and avoid macro security warnings across enterprise deployments. Cut data entry time by up to 60% when users can pick multiple values from a single dropdown without manual concatenation or helper columns. Enable real-time synchronization of dropdown choices from scanned PDFs or images using AI OCR, removing manual transcription errors. Standardize multi-select data into normalized tables compatible with Power Query, Pivot Tables, and structured references without formula corruption.

How to Move Columns in Excel: Fastest Table Methods for 2026
Mastering the shift-drag method reduces manual column reordering time by 90% compared to traditional cut-and-paste. Implementing Table Object schemas ensures 0% manual entry error by maintaining structural data integrity during swaps. Advanced AI-driven OCR integration with TabliSync eliminates unstructured data friction, accelerating large-scale data governance workflows.

Convert PDF to Excel: Proven Methods vs. AI Automation in 2026
Efficiency Gain: Implementing AI-native document intelligence reduces manual data entry time by up to 95% compared to traditional copy-paste workflows. Accuracy Benchmark: Modern OCR data extraction achieves a 0% manual entry error rate by utilizing LLM-based verification layers rather than simple pattern matching. Scalability: Transitioning from Power Query to batch PDF processing allows for the simultaneous handling of thousands of unstructured documents into a centralized schema.

What is a Pivot Table? Explain Like I'm Five (And How to Avoid Common Pitfalls)
Efficiency Leap: Reduce manual data reporting time by 90% through automated aggregation. Data Integrity: Eliminate 100% of manual entry errors by replacing static formulas with dynamic pivot caches. Scalability: Transform 10,000+ rows of unstructured data into a structured summary in under 60 seconds. Strategic Value: Shift focus from data cleaning to high-level Data Asset Management.

Mastering the Mess: How to Remove Duplicates in Excel Without Data Loss
Efficiency Gains: Reduce manual data scrubbing time by over 90% using automated workflows. Data Integrity: Achieve a 0% manual entry error rate by moving away from 'Find & Replace' to schema-based deduplication. Risk Mitigation: Prevent 100% of accidental deletions by utilizing non-destructive Power Query environments. Future-Proofing: Shift from reactive cleaning to proactive Data Hygiene through AI-integrated automation.
Stop Manual Data Entry – Extract Tables in Seconds
Convert any image or PDF table to Excel instantly with 99.9% accuracy. TabliSync's AI-powered OCR handles handwritten forms, receipts, and complex tables – then syncs directly to Google Sheets, Notion, or Airtable
Try TabliSync Free Now