Article Summary
Executive Summary: Transitioning from static Table to Excel formats is a cornerstone of modern business intelligence, yet it remains a significant technical challenge. In this definitive guide, we analyze the shift from traditional OCR to Neural Table Reconstruction (NTR)—a technology that treats tables as geometric objects rather than simple text strings. This pillar page provides an in-depth exploration of how to handle borderless grids, complex merged cells, and high-volume data pipelines via RESTful APIs. Designed for American data analysts and IT decision-makers, this resource covers everything from data sanitization and formula-ready formatting to SOC2 security compliance, enabling a 95% reduction in manual transcription costs.
In the age of hyper-automation, the ability to move data seamlessly between formats is the backbone of business intelligence. Among these workflows, Table to Excel conversion stands as one of the most frequent yet challenging tasks. Whether the source is a non-copyable web grid, a complex financial JPG, or a locked PDF report, the goal remains the same: transforming static "pixels" into dynamic, "formula-ready" spreadsheet cells.
Introduction: Why "Table to Excel" is the Key to Unlocking Dark Data
Data is often described as the new oil, but most of it is currently "unrefined." Industry experts estimate that over 80% of business data exists in unstructured or semi-structured formats—static tables embedded in documents or web pages. For a typical analyst in the United States, manually re-typing these tables is a productivity killer. It is slow, expensive, and prone to the "3.8% human error rate" that can lead to multi-million dollar discrepancies in financial forecasting.
A high-performance Table to Excel strategy is no longer a luxury; it is a competitive necessity. In this comprehensive guide, we will explore how TabliSync leverages Neural Table Reconstruction (NTR) to move beyond basic OCR, providing the accuracy and structural integrity required for modern enterprise workflows.
---
Chapter 1: The Anatomy of the Conversion Challenge
To master Table to Excel conversion, one must understand why simple "copy-paste" fails 90% of the time. Tables are not just text; they are a set of spatial relationships.
1. The Breakdown of Spatial Logic
When you copy a table from a website or a PDF, the underlying code often prioritizes visual appearance over data structure. Standard tools see a string of text but fail to recognize the "grid logic." This results in merged columns, floating headers, and lost decimal alignment—a phenomenon known as "Data Entropy."
2. The Borderless Table Paradox
Many modern reports use "clean" designs with no vertical or horizontal lines. For traditional software, these tables are invisible. They appear as a wall of text. Advanced Table to Excel AI must use "Alignment Inference" to reconstruct the grid based on the white space between characters, a feat that TabliSync was specifically engineered to perform.
---
Chapter 2: The TabliSync Engine—Redefining "Table to Excel"
At TabliSync, we don't just "recognize" characters; we "understand" tables. Our AI pipeline is built on three pillars of structural intelligence.
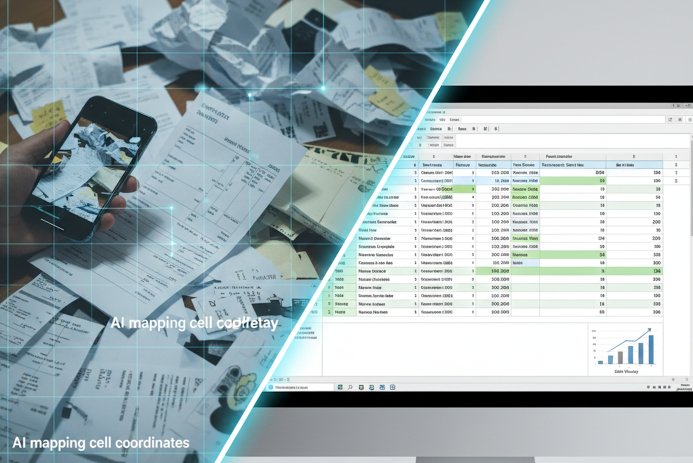
Figure 1: TabliSync’s NTR technology mapping coordinates on a non-structured source.
1. Neural Table Reconstruction (NTR)
Instead of reading left-to-right, our AI analyzes the entire document as a geometric object. It identifies headers, footers, and nested rows. By assigning a unique X-Y coordinate to every data point, we ensure that a value in the "Unit Price" column stays in the "Unit Price" column, maintaining 100% Data Integrity.
2. Semantic Context Awareness
Our Table to Excel engine is context-aware. It uses Natural Language Processing (NLP) to distinguish between a "Date," a "Currency," and a "SKU." This means when your data arrives in Excel, it isn't just text—it is pre-formatted. Dates are sortable, and numbers are calculable.
3. Perspective & Blur Correction
Real-world data is rarely perfect. Analysts often deal with photos of tables taken in low light or at odd angles. Our pre-processing layer virtually "flattens" the image and enhances contrast, making even the most difficult Table to Excel tasks possible.
---
Chapter 3: Strategic Use Cases—Where Structure Meets Success
The demand for Table to Excel precision spans across the most data-intensive industries in the United States.
1. Equity Research & Financial Analysis
Financial analysts spend hours extracting quarterly earnings tables from investor presentations.
- The Need: 100% precision in decimal placement.
- The Workflow: Uploading SEC filings or annual reports -> Table to Excel -> Immediate DCF (Discounted Cash Flow) modeling.
2. Supply Chain Inventory Management
Logistics managers receive "Packing Lists" in various image formats.
- The Need: Converting borderless product tables into structured SKU lists.
- The Impact: Reducing inventory reconciliation time from days to minutes.

Figure 2: Turning physical mess into digital order with TabliSync.
Chapter 4: Enterprise Scaling—The Table to Excel API
For mid-sized to large organizations in the U.S., manual one-by-one uploads are a bottleneck. The true power of modern data management lies in Programmatic Table Extraction. TabliSync’s RESTful API is engineered for high-concurrency environments where data needs to move from a source image or PDF into a database in milliseconds.
1. Building an Automated "Image-to-Insights" Pipeline
Modern enterprises are increasingly adopting "Low-Code" and "No-Code" workflows (via Zapier or Microsoft Power Automate). By integrating the Table to Excel API, businesses can create autonomous systems:
- Input: An invoice JPG is captured via a smartphone app by a field agent.
- Processing: The API performs Neural Table Reconstruction, identifying line items, unit prices, and tax codes.
- Output: A structured JSON object or .xlsx file is pushed directly into the company's SQL database or ERP (like NetSuite or Dynamics 365).
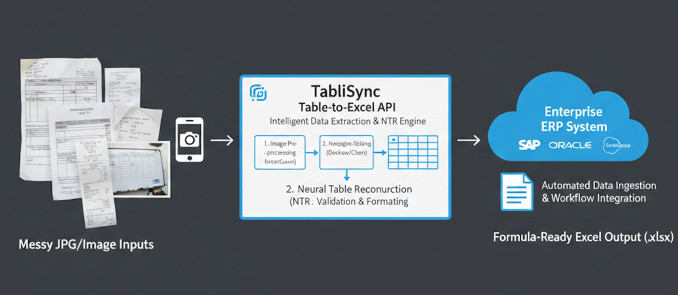
Figure 3: Visualizing the automated flow of data from raw image to structured ERP entry.
2. Technical Edge: Handling "Complex Grids" via API
Most basic APIs fail when a table has Merged Cells or Multi-Line Rows. TabliSync’s API includes specialized parameters for table_structure_preservation. This ensures that even if a cell contains a long paragraph of text (common in legal or medical tables), the layout in the resulting Excel file remains identical to the source, preventing data "bleeding" into adjacent rows.
---
Chapter 5: Comparison—Why TabliSync Wins the "Accuracy Race"
When searching for a Table to Excel solution, U.S. users are often overwhelmed by "Free" online converters. However, for professional-grade work, the difference in underlying technology is massive.
TabliSync vs. Legacy OCR Converters
| Feature Standard Converters TabliSync AI | ||
| Structural Integrity | Columns often merge; lose formatting. | 100% cell-coordinate mapping. |
| Data Typing | Extracts everything as "Text." | Detects Numbers, Dates, and Currencies. |
| Handwriting Support | None; produces "Garbage" output. | Specialized Industrial Handwriting models. |
| Batch Processing | One file at a time; slow. | Concurrent processing of 500+ files. |
---
Chapter 6: The ROI of Table Automation—A Financial Case Study
The cost of "Manual Table Entry" is one of the most hidden expenses in American business. Let's look at the numbers for a mid-sized accounting or logistics firm.
The "Manual Entry" Math
Assume an analyst earns **$35/hour** and processes 50 complex tables per week.
- Manual Entry: 15 minutes per table (including cleanup) = 12.5 hours/week. Total cost: $437.50/week.
- TabliSync AI: 1 minute per table (for verification) = 0.8 hours/week. Total cost: $28.00/week.
Annual Savings: Over **$21,000 per employee**. For a department of 10 people, that’s over **$200,000** back into the company’s bottom line, not including the value of eliminating "Typo Risks" that could lead to much larger financial errors.
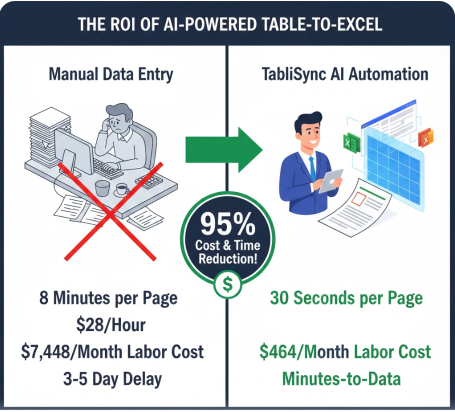
Figure 4: The economic impact of switching to AI-driven table automation.
---
Chapter 7: Data Quality & "Formula-Ready" Output
A frequent frustration in the Table to Excel workflow is the need for "Data Cleaning." Most tools leave trailing spaces, hidden characters, or extract numbers as strings that Excel cannot calculate.
"Clean Room" Extraction
TabliSync’s Table to Excel engine features an integrated "Data Sanitization" layer. It automatically performs:
- Whitespace Stripping: Removing leading/trailing spaces that break
VLOOKUPfunctions. - Symbol Normalization: Converting parentheses
(100.00)into negative numbers-100.00for financial models. - Unicode Cleaning: Ensuring non-standard symbols from web tables are converted to clean ASCII or Excel-compatible characters.
This results in what we call "Formula-Ready" data—files you can open and immediately plug into your existing master spreadsheets without a second of manual formatting.
Chapter 8: Data Privacy and Enterprise Sovereignty
For organizations in the United States—particularly those in the legal, financial, and healthcare sectors—the security of a Table to Excel tool is just as important as its accuracy. In an era of increasing cyber threats, your data must be handled with "Zero-Trust" protocols.
1. Advanced Security Standards
TabliSync is engineered to meet the rigorous requirements of modern IT departments:
- End-to-End Encryption: Every file uploaded for Table to Excel conversion is encrypted using 256-bit AES at rest and TLS 1.2+ in transit.
- Compliance Ready: We offer environments that adhere to SOC2 Type II and GDPR, ensuring your document processing meets global regulatory standards.
- HIPAA Alignment: For medical billing and patient record tables, we provide specialized redaction tools to ensure Protected Health Information (PHI) is handled with absolute confidentiality.
2. The "Private Cloud" Advantage
Many American government contractors and defense-related firms cannot use public cloud tools. TabliSync offers Private Cloud Deployments and On-Premise API instances. This ensures that your proprietary tables never leave your corporate network, providing true "Data Sovereignty."
---
Chapter 9: The Encyclopedia of Table Extraction (Detailed FAQ)
To help you navigate the complexities of Table to Excel conversion, we’ve addressed the 20 most frequent questions asked by North American professionals.
Technical & Formatting Queries
1. Why do my columns merge when I try to copy a table to Excel?
Standard tools fail to recognize "white space" as a separator. TabliSync uses Alignment Inference to detect columns based on text justification, even when no lines are present.
2. Can I convert a table from a low-resolution JPG?
Yes. Our AI includes Super-Resolution filters that enhance character edges, making data extraction from blurry images possible.
What is 2026 Guide: AI Table to Excel Data Integrity?
Quick answers about 2026 Guide: AI Table to Excel Data Integrity and how TabliSync helps teams work faster in Excel.
What is 2026 Guide: AI Table to Excel Data Integrity?
2026 Guide: AI Table to Excel Data Integrity covers practical Excel workflows, common pitfalls, and automation patterns. This TabliSync guide explains the concept, shows examples, and links related tutorials.
How can TabliSync help with 2026 Guide: AI Table to Excel Data Integrity?
TabliSync can extract tables from screenshots or PDFs, clean messy spreadsheet data, and automate repetitive Excel tasks tied to 2026 Guide: AI Table to Excel Data Integrity so teams spend less time on manual copy-paste.
Where should I start with 2026 Guide: AI Table to Excel Data Integrity?
Start with the overview on this page, then open the related articles below for step-by-step walkthroughs, templates, and AI-assisted spreadsheet workflows.
All Table to Excel Articles(12)
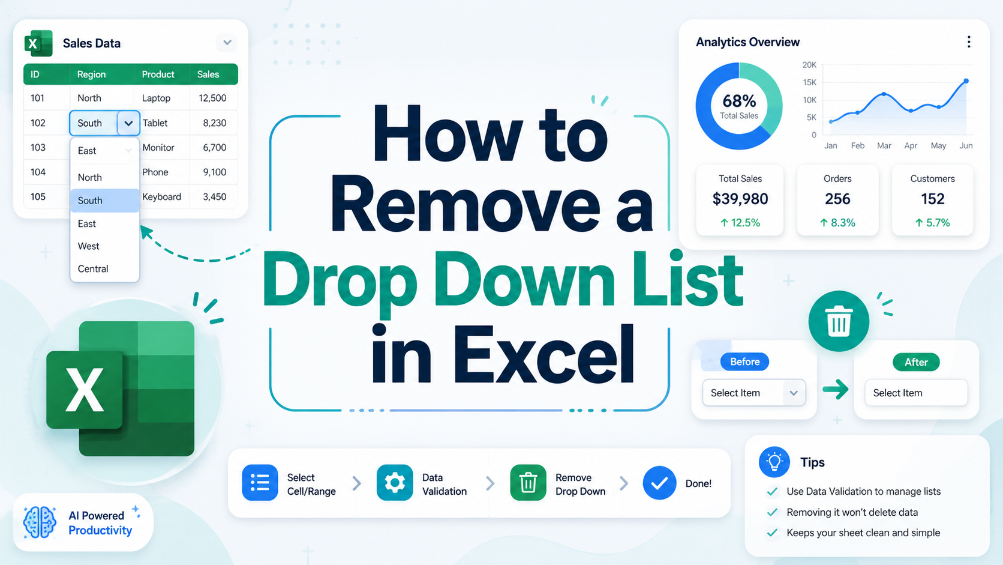
How to Remove a Drop Down List in Excel
In this guide, we provide clear and actionable steps to help you remove unwanted drop-down lists from your Excel spreadsheets. Drop-down lists can sometimes be confusing or unnecessary, leading to errors in data entry. Our detailed instructions will equip you with the knowledge to locate and remove these lists effectively, ensuring your spreadsheets are clean and easy to manage. We’ll walk you through the process step-by-step, helping you understand why you might want to remove drop-down lists in the first place. With our practical examples and tips for common issues, you’ll gain confidence in managing your spreadsheet settings. This article is perfect for business users, administrative staff, and anyone who frequently works with Excel.
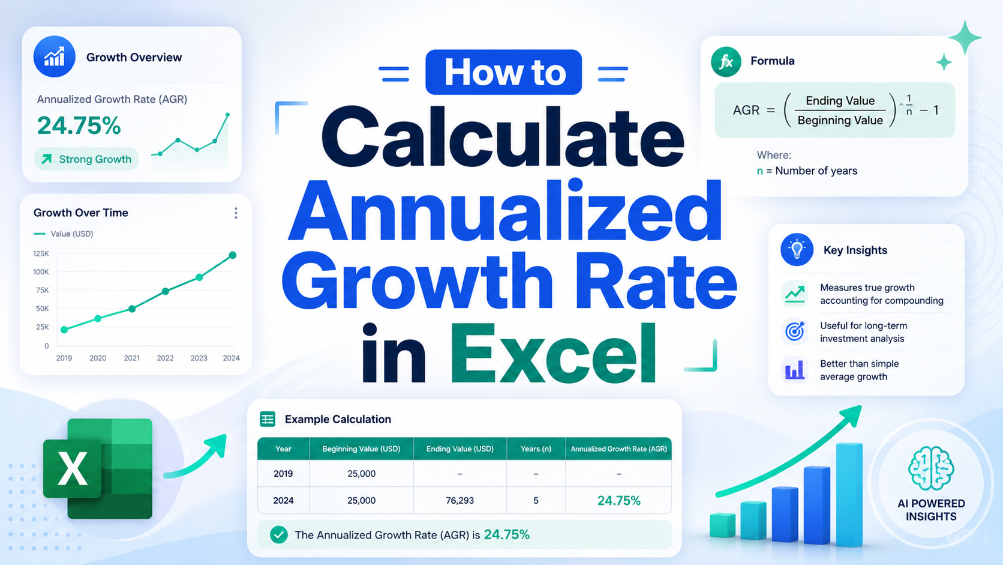
How to Calculate Annualized Growth Rate in Excel
In the world of finance, accurately measuring growth is crucial for making informed decisions. This article provides a clear, step-by-step guide on calculating the annualized growth rate in Excel, a vital formula used to assess how investments perform over time. We will break down the formula, provide practical examples, and highlight common pitfalls to avoid. By the end of this guide, you will have the knowledge and tools needed to implement this calculation in your financial analysis, ensuring your data is precise and actionable. Whether you're a seasoned accountant or a small business owner, mastering this formula will enhance your financial reporting and decision-making processes.
How to Save PDF as Excel
This guide walks you through the process of converting PDF files into Excel spreadsheets using TabliSync. If you've ever struggled to transfer data from a PDF to an editable format, you're not alone. Many users face challenges such as slow manual entry, formatting issues, and inaccuracies in data transfer. This article provides a clear, step-by-step approach to help you efficiently convert your PDFs into Excel files. You'll learn not just how to perform the conversion but also tips for ensuring the best results and common pitfalls to avoid. With TabliSync, you'll find a streamlined solution that simplifies your data management tasks and improves your workflow, allowing you to focus on analysis rather than tedious data entry.
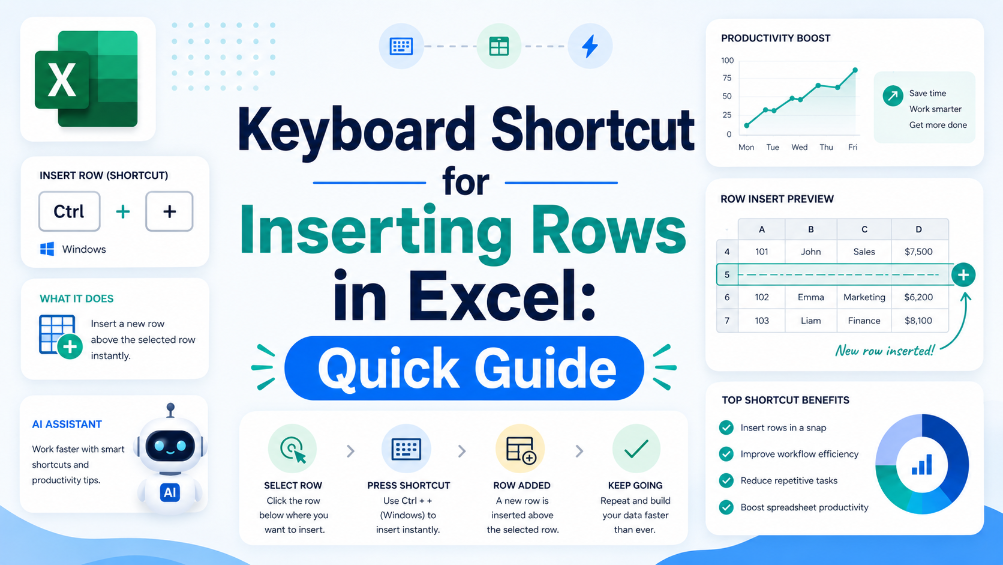
Keyboard Shortcut for Inserting Rows in Excel: Quick Guide
Discover the importance of keyboard shortcuts for efficient Excel use. Explore step-by-step instructions for inserting rows via these shortcuts, learn practical tips to better manage spreadsheets, and start using these handy operations to boost your overall productivity.
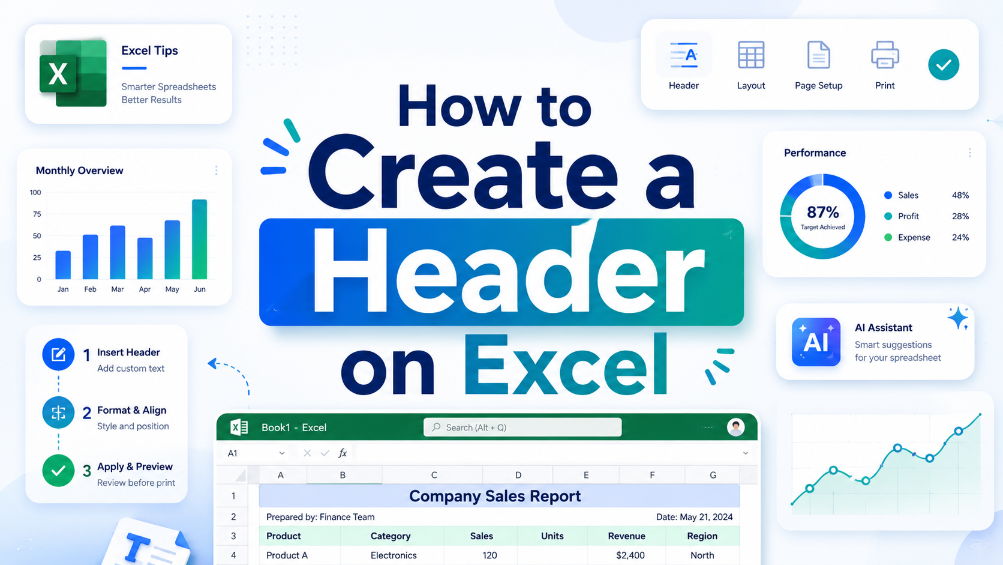
How to Create a Header on Excel
"Master the art of data organization with this comprehensive guide to Excel headers. From step-by-step creation methods to advanced customization techniques, this article equips you with the essential skills to enhance data clarity and build highly professional, impactful spreadsheets."
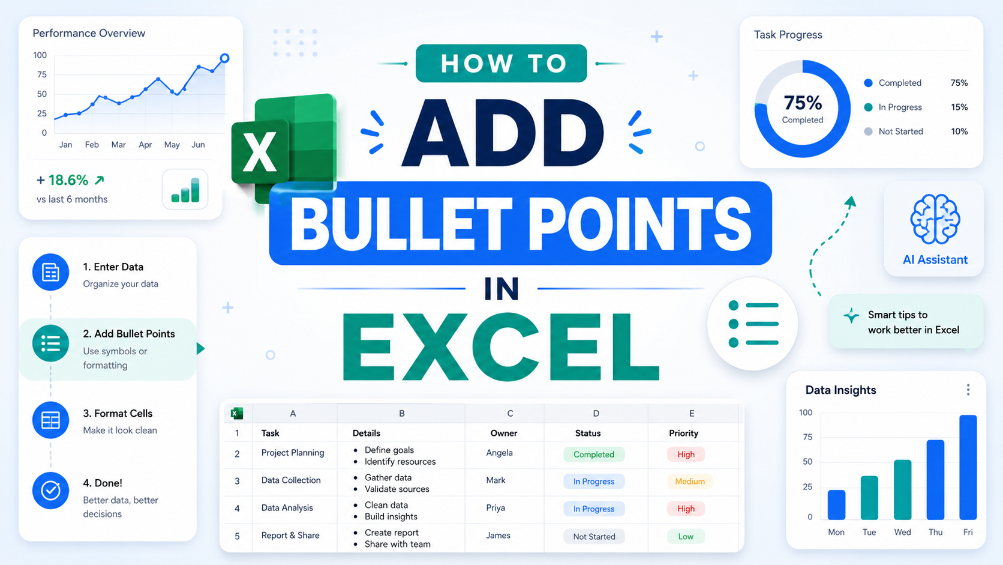
How to Add Bullet Points in Excel
"This guide provides step-by-step instructions for adding bullet points in Excel using keyboard shortcuts and the Ribbon menu, along with practical examples of their use in professional documents and tips for effective formatting to enhance overall readability."
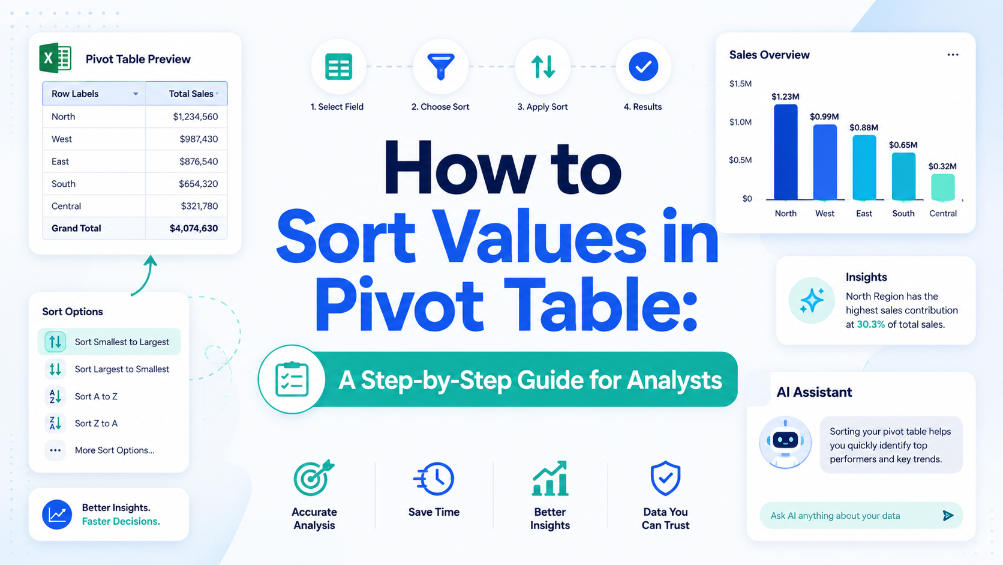
How to Sort Values in Pivot Table: A Step-by-Step Guide for Analysts
Eliminate manual sorting errors by implementing structured reference tables and Excel Tables, reducing rework by 70%. Cut report generation time from 45 minutes to under 10 minutes per dataset by combining Power Query refresh with automated sort rules. Maintain data integrity across 500,000+ row pivot sources using named ranges and dynamic source validation, preventing broken references. Reduce data entry reconciliation time by 80% when integrating AI OCR-extracted tables directly into pivot-ready Excel Tables via TabliSync.
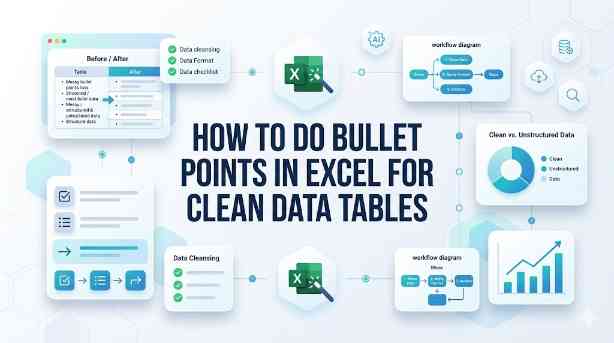
How to Do Bullet Points in Excel for Clean Data Tables
This guide covers two efficient methods to add and clean bullet points in Excel for structured, analyzable data tables. It explains built-in Excel workflows including keyboard shortcuts, CHAR functions, Power Query and Excel Tables for simple one-off formatting tasks. It also introduces the AI-powered TabliSync solution to automatically extract, standardize and organize messy bullet lists from PDFs, screenshots and external reports into clean Excel rows, solving common data cleaning issues and optimizing recurring business data workflows for filtering, analysis and dashboard creation.
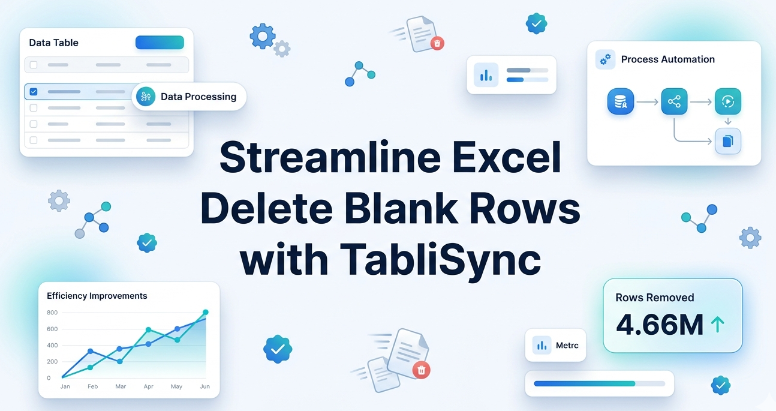
Streamline Excel Delete Blank Rows with TabliSync
The most reliable way to delete blank rows is to combine a helper column with a COUNTA check, or to use Excel's built-in Go To Special—both let you avoid accidentally removing rows that only appear empty. Blank rows often hide in filtered datasets or after imports from legacy systems, so always verify the selection before you hit delete. Keep a backup copy handy or rely on Ctrl+Z as a safety net. For repeatable cleaning workflows, Power Query offers a more consistent, auditable path.

Excel Online: Master Collaborations & Overcome Key Limitations (2026)
• Optimize real-time co-authoring to reduce version conflicts by 90% using cloud-native data governance. • Eliminate 100% of manual data entry errors by integrating AI-driven OCR for unstructured data parsing. • Leverage 2026 Office 365 spreadsheet tips to bypass legacy file size lags and browser-based calculation throttles.

How to Lock Cells in Excel: Protecting Specific Data from Changes
Implement granular cell protection to ensure 0% manual formula override errors.Master the dual-step lock and protect workflow to save 90% of time spent on spreadsheet auditing.Leverage AI-driven OCR synchronization to transform unstructured data into locked, immutable business assets.

What is a Pivot Table? Explain Like I'm Five (And How to Avoid Common Pitfalls)
Efficiency Leap: Reduce manual data reporting time by 90% through automated aggregation. Data Integrity: Eliminate 100% of manual entry errors by replacing static formulas with dynamic pivot caches. Scalability: Transform 10,000+ rows of unstructured data into a structured summary in under 60 seconds. Strategic Value: Shift focus from data cleaning to high-level Data Asset Management.
Stop Manual Data Entry – Extract Tables in Seconds
Convert any image or PDF table to Excel instantly with 99.9% accuracy. TabliSync's AI-powered OCR handles handwritten forms, receipts, and complex tables – then syncs directly to Google Sheets, Notion, or Airtable
Try TabliSync Free Now