AIデータ分析:コーディング不要で高度な統計分析と予測インサイト
生データを実行可能なビジネスインテリジェンスへ - 統計検定、パターン認識、予測をシンプルに
統計学の博士号がなくても、プロ品質のデータ分析を実現。AIが高度な統計検定を実行し、隠れたパターンを発見し、自然言語クエリで精度の高い予測を生成します。t検定・回帰分析から異常検知・予測モデリングまで、エンタープライズ級分析を短時間で提供します。
What is AIデータ分析:コーディング不要で高度な統計分析と予測インサイト?
統計学の博士号がなくても、プロ品質のデータ分析を実現。AIが高度な統計検定を実行し、隠れたパターンを発見し、自然言語クエリで精度の高い予測を生成します。t検定・回帰分析から異常検知・予測モデリングまで、エンタープライズ級分析を短時間で提供します。
TabliSync:AIでExcel作業を自動化
実務のワークフロー、データ処理、チーム協業のために設計されたインテリジェントな自動化レイヤーです。
高度な統計テスト
仮説の自動チェックと結果の解釈で t 検定、ANOVA、カイ二乗検定、回帰分析を実行します。信頼区間と p 値を含む出版準備完了の統計結果を取得します。
高度な統計テスト
仮説の自動チェックと結果の解釈で t 検定、ANOVA、カイ二乗検定、回帰分析を実行します。信頼区間と p 値を含む出版準備完了の統計結果を取得します。...
インテリジェントなパターン認識
AI がデータを自動的に分析してトレンド、季節性、外れ値、異常を検出します。手動分析が見逃す可能性のある隠れたパターンを発見し、視覚的なハイライトと詳細な説明を提供します。
インテリジェントなパターン認識
AI がデータを自動的に分析してトレンド、季節性、外れ値、異常を検出します。手動分析が見逃す可能性のある隠れたパターンを発見し、視覚的なハイライトと詳細な説明を...
予測分析と予測
時系列分析、回帰モデル、機械学習を使用して正確な予測を生成します。信頼区間、シナリオ計画、モデル精度メトリクスを取得します。
予測分析と予測
時系列分析、回帰モデル、機械学習を使用して正確な予測を生成します。信頼区間、シナリオ計画、モデル精度メトリクスを取得します。...
自動レポート生成
エグゼクティブサマリー、詳細な調査結果、可視化、推奨事項を含む包括的な分析レポートを作成します。PowerPoint、PDF、Word 形式にエクスポートします。
自動レポート生成
エグゼクティブサマリー、詳細な調査結果、可視化、推奨事項を含む包括的な分析レポートを作成します。PowerPoint、PDF、Word 形式にエクスポートします...
AI データサマリー
主要なビジネス指標について、数秒でわかりやすい KPI スナップショット、指標の集計、そして平易な言葉での要約を取得します。
AI データサマリー
主要なビジネス指標について、数秒でわかりやすい KPI スナップショット、指標の集計、そして平易な言葉での要約を取得します。...
高度なデータ変換
数式やコードを書かずに、AI 支援の変換ワークフローで複雑なデータセットを再構成、クリーニング、正規化します。
高度なデータ変換
数式やコードを書かずに、AI 支援の変換ワークフローで複雑なデータセットを再構成、クリーニング、正規化します。...
高度な統計テスト
仮説の自動チェックと結果の解釈で t 検定、ANOVA、カイ二乗検定、回帰分析を実行します。信頼区間と p 値を含む出版準備完了の統計結果を取得します。
インテリジェントなパターン認識
AI がデータを自動的に分析してトレンド、季節性、外れ値、異常を検出します。手動分析が見逃す可能性のある隠れたパターンを発見し、視覚的なハイライトと詳細な説明を提供します。
予測分析と予測
時系列分析、回帰モデル、機械学習を使用して正確な予測を生成します。信頼区間、シナリオ計画、モデル精度メトリクスを取得します。
高度な統計テスト
仮説の自動チェックと結果の解釈で t 検定、ANOVA、カイ二乗検定、回帰分析を実行します。信頼区間と p 値を含む出版準備完了の統計結果を取得します。...
インテリジェントなパターン認識
AI がデータを自動的に分析してトレンド、季節性、外れ値、異常を検出します。手動分析が見逃す可能性のある隠れたパターンを発見し、視覚的なハイライトと詳細な説明を...
予測分析と予測
時系列分析、回帰モデル、機械学習を使用して正確な予測を生成します。信頼区間、シナリオ計画、モデル精度メトリクスを取得します。...
自動レポート生成
エグゼクティブサマリー、詳細な調査結果、可視化、推奨事項を含む包括的な分析レポートを作成します。PowerPoint、PDF、Word 形式にエクスポートします...
AI データサマリー
主要なビジネス指標について、数秒でわかりやすい KPI スナップショット、指標の集計、そして平易な言葉での要約を取得します。...
高度なデータ変換
数式やコードを書かずに、AI 支援の変換ワークフローで複雑なデータセットを再構成、クリーニング、正規化します。...
自動レポート生成
エグゼクティブサマリー、詳細な調査結果、可視化、推奨事項を含む包括的な分析レポートを作成します。PowerPoint、PDF、Word 形式にエクスポートします。
AI データサマリー
主要なビジネス指標について、数秒でわかりやすい KPI スナップショット、指標の集計、そして平易な言葉での要約を取得します。
高度なデータ変換
数式やコードを書かずに、AI 支援の変換ワークフローで複雑なデータセットを再構成、クリーニング、正規化します。
TabliSyncの動作を見る:製品デモ
複雑なワークフローが数分でシンプルな自動化プロセスに変わる様子をご覧ください。
プロフェッショナルレベルの分析
データサイエンスの博士号なしで高度な統計手法と機械学習アルゴリズムにアクセスできます。数分でエンタープライズレベルのインサイトを取得します。
即座のインサイト
何週間もの手動分析を避けます。AI がデータを処理し、リアルタイムで実行可能なインサイトを提供し、より迅速な意思決定を支援します。
コーディング不要
1行のコードも書かずに複雑な統計分析と予測モデリングを実行します。AI がすべての技術的な複雑さを処理します。
Before / After:TabliSyncによる変化
手作業のフローと自動化を比較し、時間短縮とミス削減を確認できます。
従来のやり方
従来のやり方
- 手作業が多く時間がかかる
- 担当者ごとに運用がばらつく
- 入力ミスや抜け漏れが起きやすい
- 更新や保守で手戻りが発生する
- 業務拡大時にスケールしにくい
TabliSync を使う場合
スマートなやり方
- AI が繰り返し作業を自動化
- 運用を標準化し結果が安定
- 人的ミスと手戻りを削減
- 変更をすばやく反映可能
- 大規模運用にも対応しやすい
仕組み - 簡単な開始ステップ
開始してデータワークフローを変革するためのシンプルなステップ
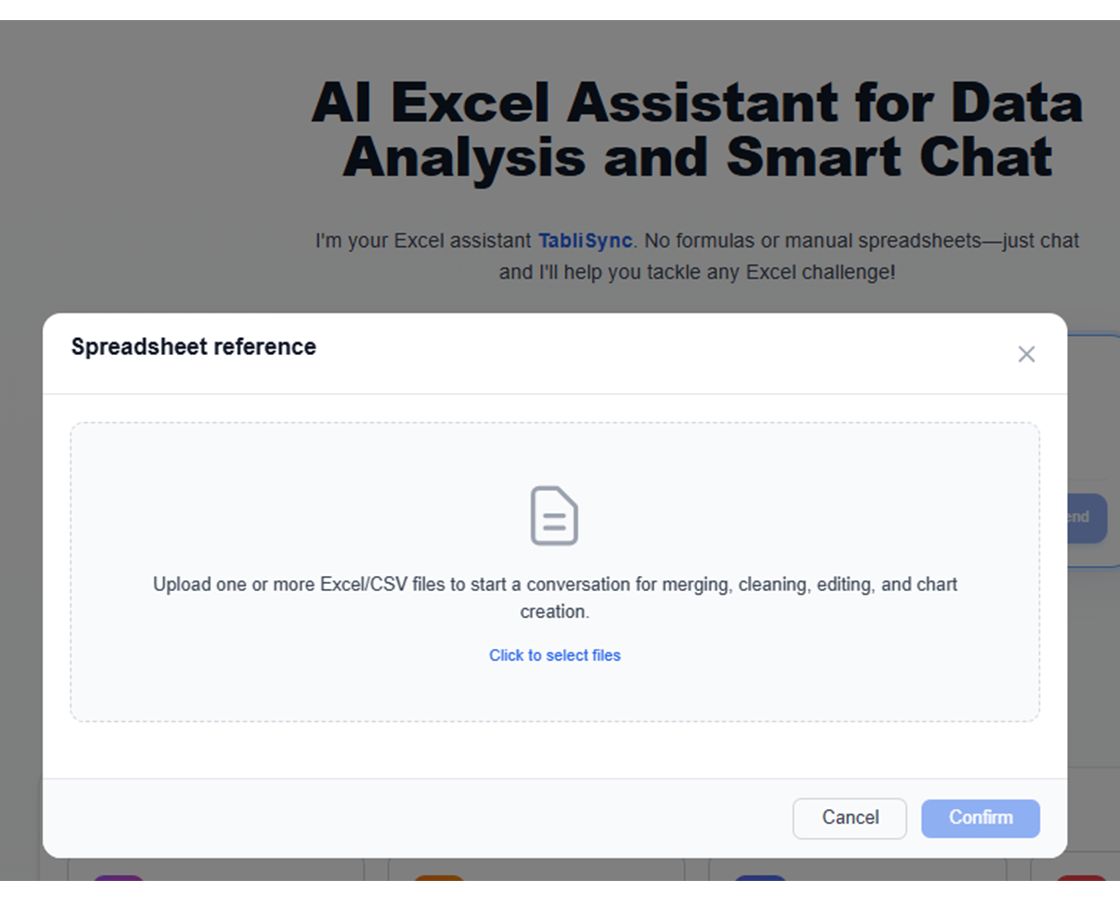
データをアップロードして接続
Excel、CSV、データベース、またはクラウドストレージからデータをインポートします。AI がデータ型、関係、品質の問題を自動的に検出して分析の準備をします。
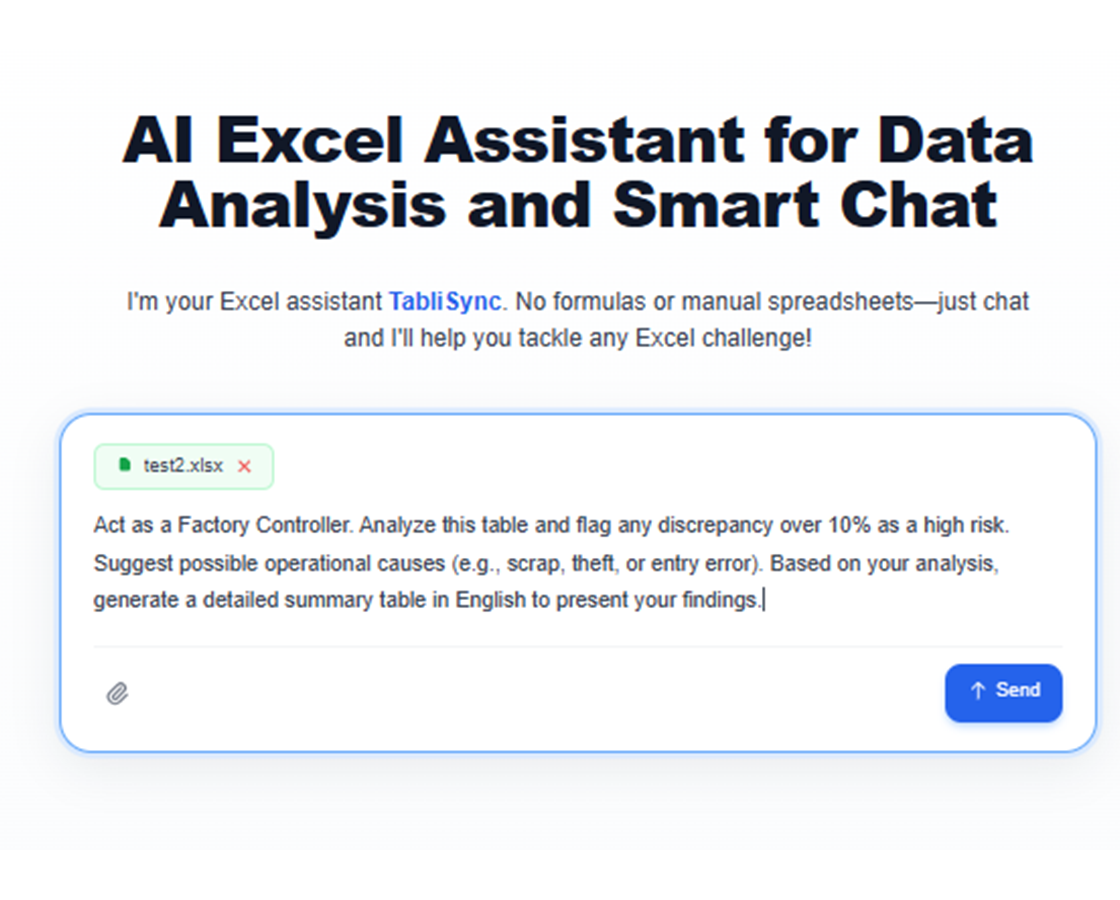
分析的な質問をする
「顧客離脱に影響する要因は何か?」や「次の四半期の売上を予測」などの自然言語クエリを使用します。AI が質問を高度な統計分析に変換します。
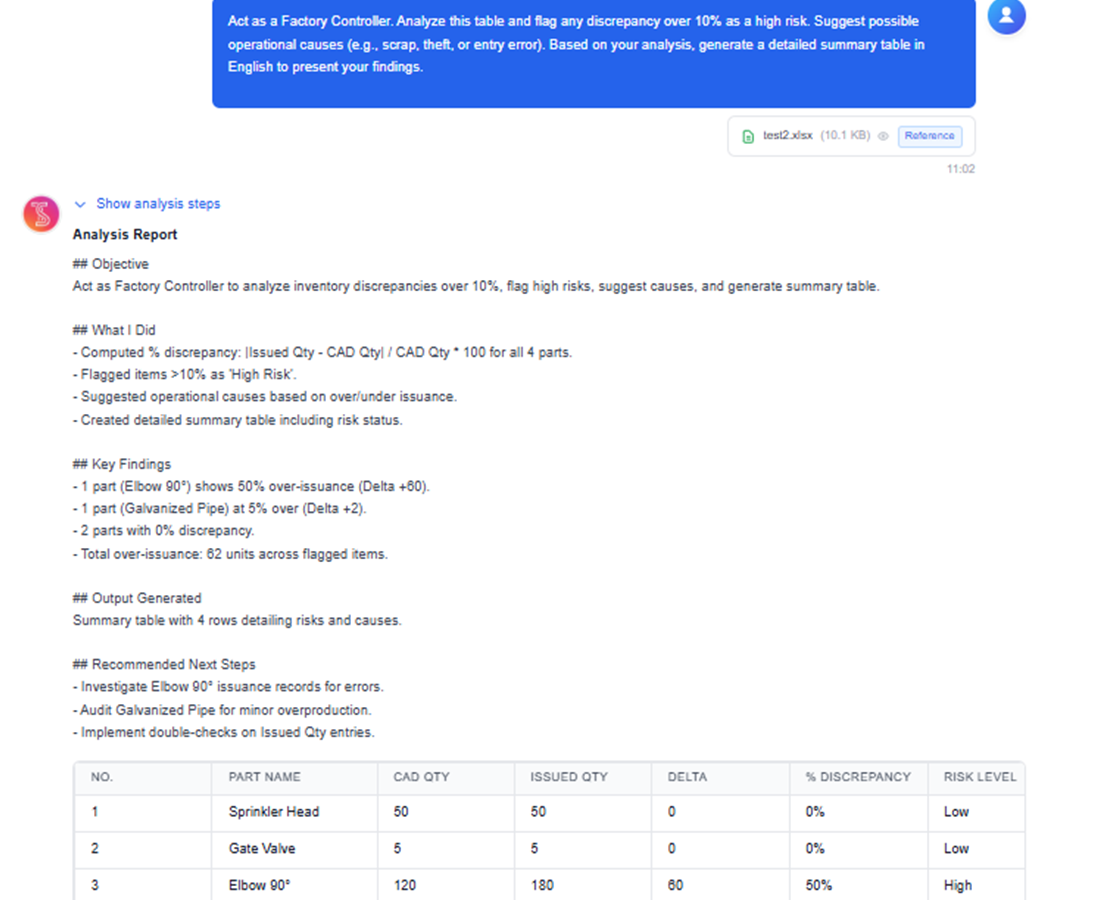
AI 生成のインサイトを確認
統計テスト、可視化、平易な英語の説明を含む包括的な結果を取得します。AI が主要な調査結果を強調し、実行可能な推奨事項を提供します。
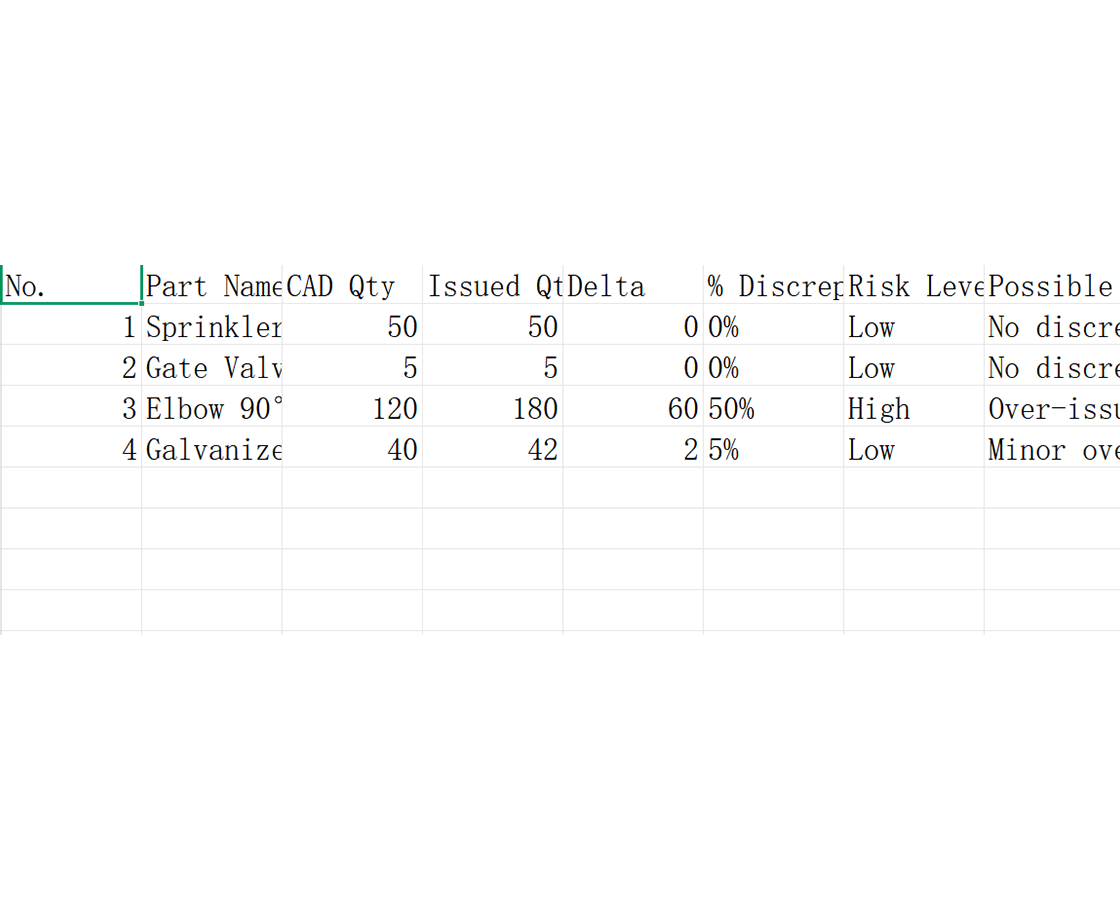
プロフェッショナルなレポートをエクスポート
詳細な分析レポート、インタラクティブなダッシュボード、または生の結果をダウンロードします。プロフェッショナルなプレゼンテーションとドキュメントを通じて関係者と調査結果を共有します。
データをアップロードして接続
Excel、CSV、データベース、またはクラウドストレージからデータをインポートします。AI がデータ型、関係、品質の問題を自動的に検出して分析の準備をします。
分析的な質問をする
「顧客離脱に影響する要因は何か?」や「次の四半期の売上を予測」などの自然言語クエリを使用します。AI が質問を高度な統計分析に変換します。
AI 生成のインサイトを確認
統計テスト、可視化、平易な英語の説明を含む包括的な結果を取得します。AI が主要な調査結果を強調し、実行可能な推奨事項を提供します。
プロフェッショナルなレポートをエクスポート
詳細な分析レポート、インタラクティブなダッシュボード、または生の結果をダウンロードします。プロフェッショナルなプレゼンテーションとドキュメントを通じて関係者と調査結果を共有します。
実際の成果:成功事例
TabliSyncで毎週時間を節約しているチームや専門家の声をご紹介します。
"以前は数日かかった分析インサイトが、今は数分で得られます。"

Daniel Miller
マーケティング責任者
"データチームを待たずに自分でトレンド分析できるようになりました。"

Jessica Taylor
営業マネージャー
"統計の専門知識がなくても使えるデータ分析ツールです。"

Thomas Anderson
事業オーナー
領域別アナリティクス
トレンド追跡から予測まで、実務の意思決定向け。
ビジネスインテリジェンスチーム
生のビジネスデータをデータ駆動の意思決定のための戦略的インサイトに変換します。成長機会を特定し、ビジネスパフォーマンスを最適化します。
顧客生涯価値分析とセグメンテーション
市場トレンドの特定と競合分析
パフォーマンスメトリクスの最適化と KPI 追跡
収益予測と予算計画
研究と学術
出版準備完了の結果で研究論文、研究、学術プロジェクトのための厳密な統計分析を実施します。
統計的有意性テスト付き調査データ分析
実験デザインと結果評価
メタ分析と系統的レビューのサポート
出版準備完了の統計レポート
マーケティング分析
高度な統計手法と予測モデリングでキャンペーンパフォーマンス、顧客行動、マーケティング ROI を分析します。
マルチタッチアトリビューションモデリングと分析
カスタマージャーニー分析と最適化
A/B テストデザインと統計評価
マーケティングミックスモデリングと予算配分
金融サービス
高度な統計モデルと規制コンプライアンスでリスク分析、ポートフォリオ最適化、財務予測を実行します。
信用リスクモデリングとデフォルト予測
ポートフォリオ最適化とリスク評価
不正検出と異常分析
規制レポートとコンプライアンス分析
よくある質問
この機能の使い方や期待できる結果、連携方法などのよくある質問にお答えします。
AI データ分析ワークフローで機密ビジネスデータをどのように保護しますか?
データアップロードと分析リクエストは暗号化接続と権限ベースのアクセス制御で処理されます。workspace の可視範囲を制限し、内部ポリシーに従い保持期間を管理できます。
SQL や Python なしで AI でスプレッドシートのトレンドを分析するには?
データセットをアップロードし、自然言語で質問し、生成されたトレンド出力とサマリーを確認します。コーディング不要で迅速な探索を支援します。
AI は KPI 時系列データで異常とリスクシグナルを検出できますか?
はい。分析ワークフローは異常な変動をマークし、分散/差異要因を強調し、より深い調査が必要な領域を示します。
生データから経営層向け KPI サマリーを生成する最良の方法は?
サマリー指向のプロンプトを使用し、主要指標、ドライバー、次のステップを抽出します。週次・月次の経営更新に適した簡潔なコンテンツが生成されます。
TabliSync は分析前に複雑なデータセットを変換・再構成できますか?
はい。インサイト生成前に分割、結合、ピボット、クリーンアップ操作を実行し、一貫した構造に基づく分析を保証できます。
乱れた運用スプレッドシートでの AI 生成インサイトの精度は?
コアヘッダーと指標定義が明確な場合に品質が最も安定します。重要な意思決定では全面展開前に上位結論と主要仮定を検証してください。
TabliSync が単なるコンバーター以上である理由
クロスプラットフォームデータ管理、コラボレーション、自動化のための AI 搭載ツールの完全なエコシステムでデータワークフローを変革します。
クロスプラットフォーム同期
変換されたデータは Google Sheets、Notion、Airtable、その他のプラットフォーム間で自動的に同期されます。手動でのインポートやエクスポートは不要です。
リアルタイムコラボレーション
抽出されたデータを即座に共有してコラボレーションします。チームメンバーは異なるプラットフォーム間でデータにアクセス、編集、分析できます。
自動更新
自動データ更新スケジュールを設定します。スプレッドシートは手動介入なしに最新の状態を保ち、何時間もの反復作業を節約します。
完全なデータエコシステムに参加
統合された AI ツールスイートでデータの可能性を最大限に引き出す
データワークフローを変革する準備はできましたか?
データニーズに TabliSync を信頼する何千ものプロフェッショナルに参加しましょう
クレジットカード不要 • 毎日データを同期する10,000+ユーザーに参加